
python で株価指数の取得その2
日経平均株価とかダウはよくテレビとかででるけど
フランスとかイギリスなどのはネットで調べる必要があり
アプリなどでもあまりでないことが多いので表示できるように
investpy で実験
import investpy
from datetime import datetime, date, timedelta
from dateutil.relativedelta import relativedelta
import altair as alt
import pandas as pd
でライブラリをインポート
today = datetime.today().strftime('%d/%m/%Y')
で今日の日付を取得し
フォーマットを investpy で使う日付に変更
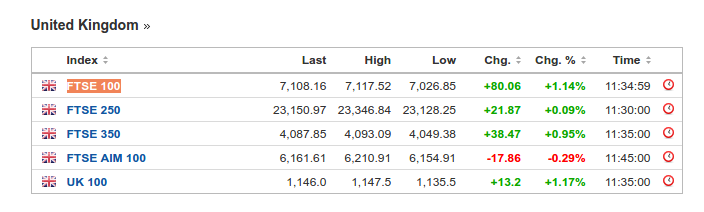
今回はイギリスの指標の
FTSE 100
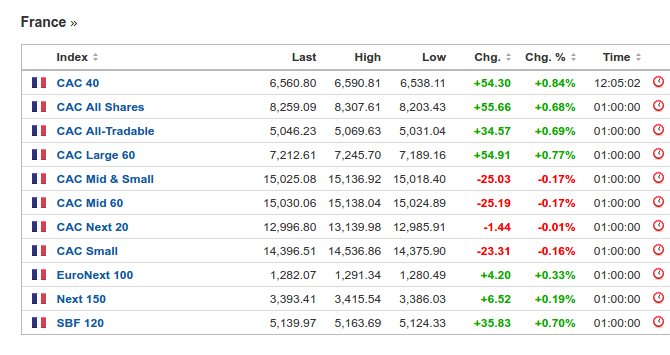
フランスの
CAC 40
を取得
フランスは
france
イギリスは
united kingdom
が国名になるので
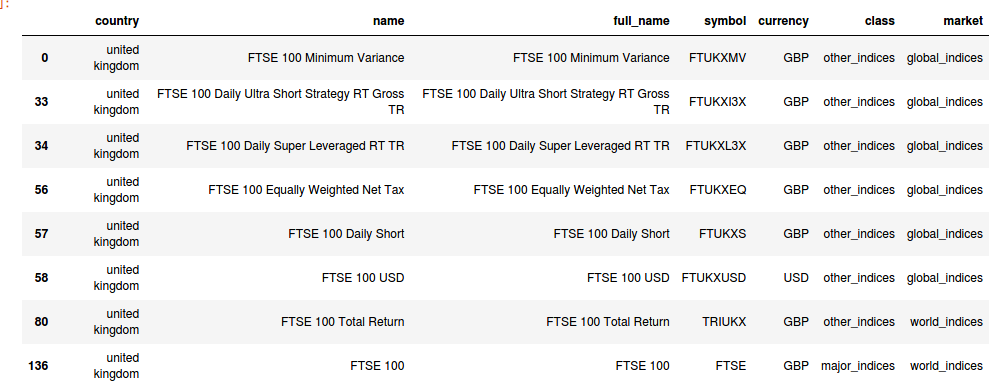
uk_index =investpy.indices.get_indices(country="united kingdom")
f_index =investpy.indices.get_indices(country="france")
で取得して
uk_index[uk_index['full_name'].str.contains('FTSE 100')]
で検索し
name が FTSE 100 を確認

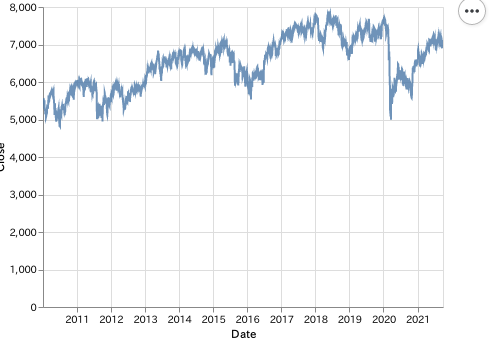
ftse = investpy.get_index_historical_data(index='FTSE 100',country='united kingdom',
                                        from_date='01/01/2010',to_date=today)
でFTSE 100の値を取得し
ftse.index = ftse.index.strftime('%Y/%m%d')
ftse = ftse.T
ftse = ftse.T.reset_index()
でDateをカラムに追加
chart =(
    alt.Chart(ftse)
    .mark_line(opacity=0.8,clip=True)
    .encode(
        x="Date:T",
        y=alt.Y("Close:Q",stack=None)
    )
)
chart
でチャートで表示
次にCAC 40
f_index[f_index['full_name'].str.contains('CAC 40')]
で検索

cac40 = investpy.get_index_historical_data(index='CAC 40',country='france',
                                        from_date='01/01/2010',to_date=today)
で値を取得
cac40.index = cac40.index.strftime('/%Y/%m/%d')
cac40 = cac40.T
cac40 = cac40.T.reset_index()
で日付フォーマット変更と
Date をカラムに追加
chart =(
    alt.Chart(cac40)
    .mark_line(opacity=0.8,clip=True)
    .encode(
        x="Date:T",
        y=alt.Y("Close:Q",stack=None)
    )
)
chart
でチャート表示

他にもアジアや中東などの株価指数なども
おなじ要領で調べてグラフ化が可能

コメント