
python で株価指数の取得
【Python】investpyを使ったInvesting.comからのデータ取得方法
で
指数データの取得方法が乗っていたので参考に
import investpy
from datetime import datetime, date, timedelta
from dateutil.relativedelta import relativedelta
import altair as alt
import pandas as pd
でライブラリをインポート
today = datetime.today().strftime('%d/%m/%Y')
で今日の日付を取得し
フォーマットを investpy で使う日付に変更
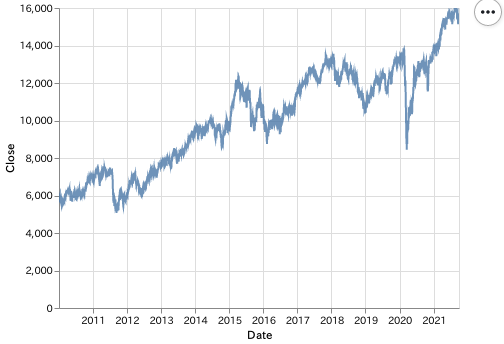
df = investpy.get_index_historical_data(index='S&P 500',country='united states',
                                        from_date='01/01/2010',to_date=today)
で
2010年1月1日から今日までの
S&P500
のデータを取得
df.index = df.index.strftime('%Y/%m/%d')
で日付フォーマットを altair で使う形式に変更
df = df.T
df= df.T.reset_index()
でDate をカラムに追加

chart =(
    alt.Chart(df)
    .mark_line(opacity=0.8,clip=True)
    .encode(
        x="Date:T",
        y=alt.Y("Close:Q",stack=None)
    )
)
chart
でチャートを表示
S&P500 ができたのでダウ平均を取得
使用したメソッドの
get_index_historical_data
については
investpy.indices
を参考に
パラメータに指定する株価指数については
https://jp.investing.com/indices/world-indices
で日本語版がでるがコードを指定するので
https://www.investing.com/indices/usa-indices
を参考に
dow =  investpy.get_index_historical_data(index='Dow Jones',country='united states',
                                        from_date='01/01/2010',to_date=today)
としたが
---------------------------------------------------------------------------
RuntimeError                              Traceback (most recent call last)
<ipython-input-23-37a90ad00d34> in <module>
----> 1 dow =  investpy.get_index_historical_data(index='DJI',country='united states',
      2                                         from_date='01/01/2010',to_date=today)

~/anaconda3/lib/python3.8/site-packages/investpy/indices.py in get_index_historical_data(index, country, from_date, to_date, as_json, order, interval)
    511
    512     if index not in list(indices['name'].apply(unidecode).str.lower()):
--> 513         raise RuntimeError("ERR#0045: index " + index + " not found, check if it is correct.")
    514
    515     full_name = indices.loc[(indices['name'].apply(unidecode).str.lower() == index).idxmax(), 'full_name']

RuntimeError: ERR#0045: index dji not found, check if it is correct.
となり
指定するコードが違うらしい
VIX 指数(恐怖指数)については
vix = investpy.get_index_historical_data(index='S&P 500 VIX',country='united states',
                                        from_date='01/01/2010',to_date=today)
vix
とすれば表示される
どうやら名称が違うようなので
プライマリーセクターに絞り検索
stock_index =investpy.indices.get_indices(country="united states")
stock_index[stock_index['class']=='primary_sectors']
64に絞りこみできるので
stock_index =investpy.indices.get_indices(country="united states")
stock_index[stock_index['class']=='primary_sectors'].head(35)


stock_index =investpy.indices.get_indices(country="united states")
stock_index[stock_index['class']=='primary_sectors'].tail(35)
で探すが該当するものがでない
pandasで特定の文字列を含む行を抽出(完全一致、部分一致)
で部分一致で検索をする
str.startswith()
で文字列で始まるもの
もしくは
str.contains()
で文字列を含むもの
を対象にする
dow =stock_index[(stock_index['market']=='global_indices') & (stock_index['class']=='other_indices')]
dow[dow['name'].str.contains('DJ')]
で探したがそれらしいものはでてこない
stock_index =investpy.indices.get_indices(country="united states")
stock_index[stock_index['full_name'].str.contains('Dow Jones Industrial')]
で検索すると
Dow 30 が表示される
dow =  investpy.get_index_historical_data(index='Dow 30',country='united states',
                                        from_date='01/01/2010',to_date=today)
dow
で表示されるので
S&P500のときと同じようにチャートを表示する
dow=dow.T
dow = dow.T.reset_index()
で Date をカラムに追加
chart =(
    alt.Chart(dow)
    .mark_line(opacity=0.8,clip=True)
    .encode(
        x="Date:T",
        y=alt.Y("Close:Q",stack=None)
    )
)
chart
でチャート表示
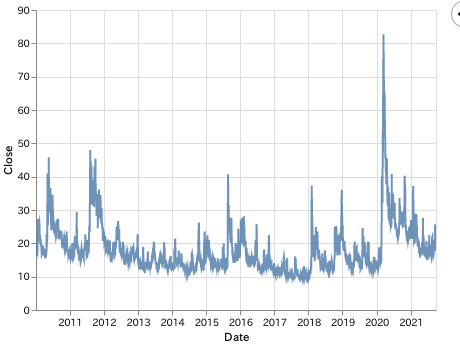
vix 恐怖指数をチャートにするなら
vix = investpy.get_index_historical_data(index='S&P 500 VIX',country='united states',
                                        from_date='01/01/2010',to_date=today)
でデータを取得
vix = vix.T
vix = vix.T.reset_index()
で
Date をカラムに追加
chart =(
    alt.Chart(vix)
    .mark_line(opacity=0.8,clip=True)
    .encode(
        x="Date:T",
        y=alt.Y("Close:Q",stack=None)
    )
)
chart
でチャートで表示
他の国の株価指数も取得できる
その場合、国の指定をする必要があり
investpy.indices.get_index_countries()
で取得可能な国が表示できる
index_list = investpy.indices.get_index_countries()
index_list
で取得可能な国を表示可能
ユーロ圏の株価指数を調べるのなら
https://www.investing.com/indices/european-indices
で
株価指数の名前を調べる
ダウ平均が Dow 30 というように
名称が investpy のときわからないときがあるので
DAX
Euro Stoxx 50
がある国を調べる
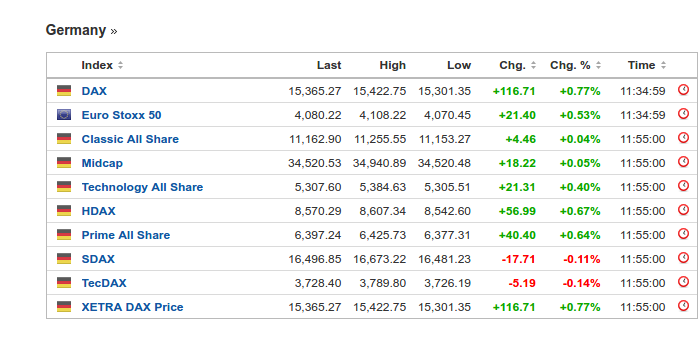
Germany なので
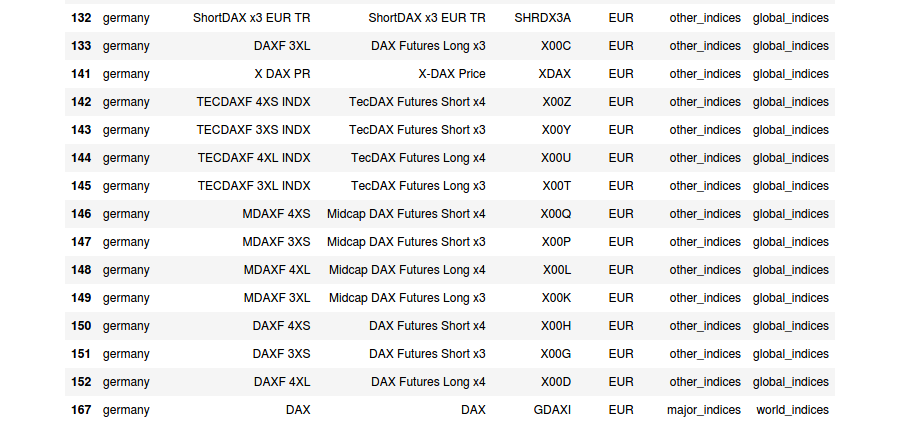
euro_index =investpy.indices.get_indices(country="germany")
で取得し
https://www.investing.com/indices/germany-30
から
名称が DAX(GDAXI)
であるのを確認したら
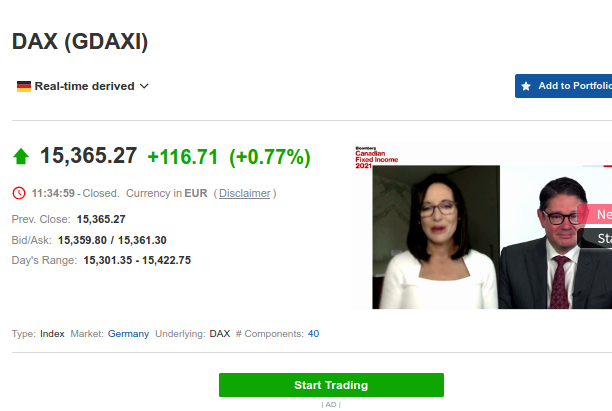
euro_index[euro_index['full_name'].str.contains('DAX')]
で探すと出てこないので
euro_index[euro_index['name'].str.contains('DAX')]
で検索すると出てきた
あとは
dax = investpy.get_index_historical_data(index='DAX',country='germany',
                                        from_date='01/01/2010',to_date=today)
でDAXの値を取得
dax.index = dax.index.strftime('%Y/%m/%d')
dax = dax.T
dax = dax.T.reset_index()
で日付フォーマット変更と
Date をカラムに追加
chart =(
    alt.Chart(dax)
    .mark_line(opacity=0.8,clip=True)
    .encode(
        x="Date:T",
        y=alt.Y("Close:Q",stack=None)
    )
)
chart
でチャート表示

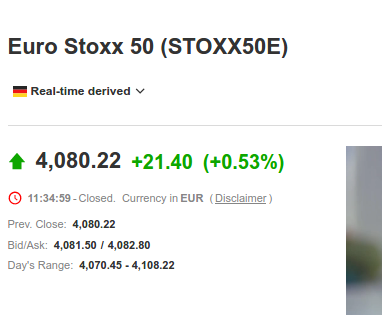
応用でユーロストック50なら
https://www.investing.com/indices/eu-stoxx50
で
Euro Stoxx 50 (STOXX50E)
となっているのを確認できるので
euro_index =investpy.indices.get_indices(country="germany")
euro_index[euro_index['name'].str.contains('Euro Stoxx 50')]
で検索すると簡単にヒットする
あとは
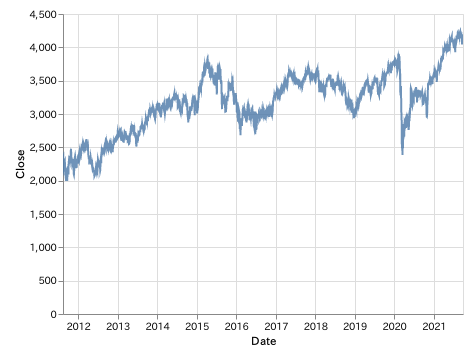
euro_stock50 = investpy.get_index_historical_data(index='Euro Stoxx 50',country='germany',
                                        from_date='01/01/2010',to_date=today)

euro_stock50.index = euro_stock50.index.strftime('%Y/%m/%d')
euro_stock50 = euro_stock50.T
euro_stock50 = euro_stock50.T.reset_index()

chart =(
    alt.Chart(euro_stock50)
    .mark_line(opacity=0.8,clip=True)
    .encode(
        x="Date:T",
        y=alt.Y("Close:Q",stack=None)
    )
)
chart
で表示できる

コメント