
python で債権利回りの表示
債権は
https://investpy.readthedocs.io/_api/bonds.html
で取得できそう
ただし、債権利回りがでてないので検索
債権利回りコードは
https://stackoverflow.com/questions/65063436/pulling-yields-data-from-investpy-package
を参考に
import investpy
data = investpy.bonds.get_bond_historical_data(bond='South Africa 2Y',
                                               from_date='01/01/2019',
                                               to_date='31/12/2019')
data
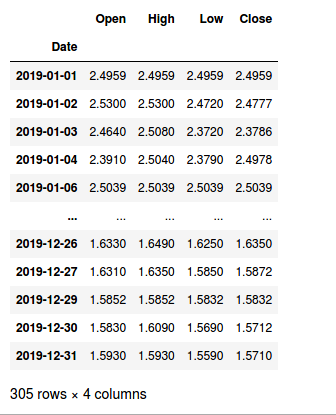
で南アフリカ2年債の利回りを表示可能
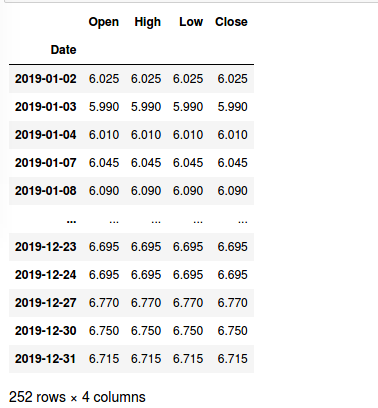
米国債の2年債の利回りなら
data = investpy.bonds.get_bond_historical_data(bond='U.S. 2Y',
                                               from_date='01/01/2019',
                                               to_date='31/12/2019')

data
でOK
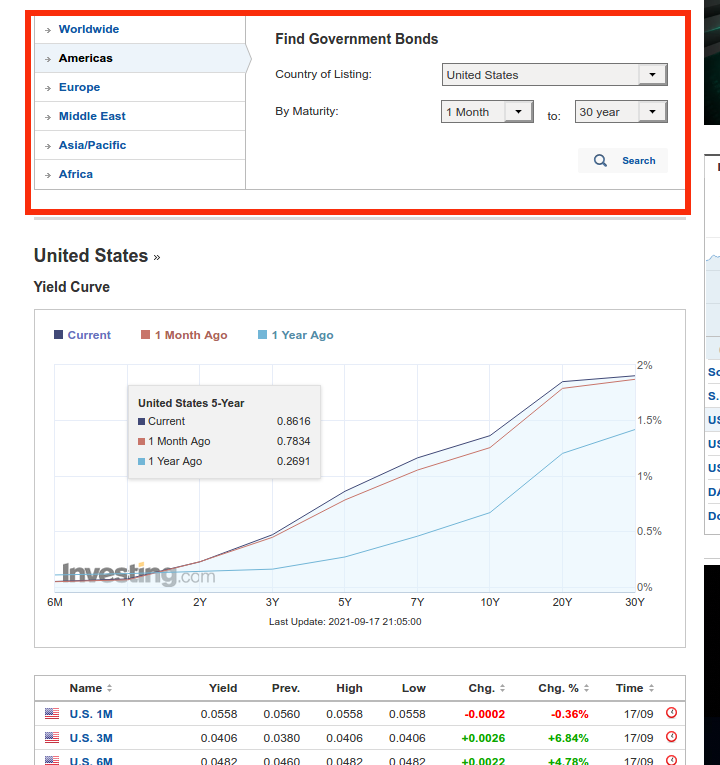
債権の国コードや種類については
https://za.investing.com/rates-bonds/world-government-bonds?maturity_from=10&maturity_to=310
で調べることができる
Find Government Bonds
で
Country of Listing で国を選べば
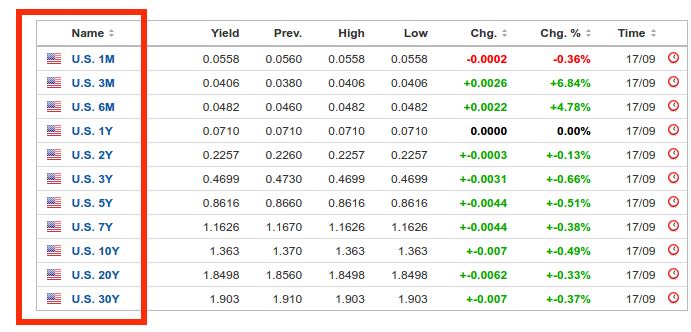
チャートの下のほうに債権の種類が表示されるので
これをもとに
米国債2年なら
U.S. 2Y
となる
altair で表示するなら
商品市場でWTI、金価格のときにやったのと同じように
行う
今回は日付を date で取得し
年始から今日までの米国債2年債の利回りチャートを表示
from datetime import datetime, date, timedelta
from dateutil.relativedelta import relativedelta

today = datetime.today().strftime('%d/%m/%Y')
today
で今日の日付を取得
US2Y = investpy.bonds.get_bond_historical_data(bond='U.S. 2Y',
                                               from_date='01/01/2021',
                                               to_date=today)
US2Y
で年始から今日までの利回りを取得
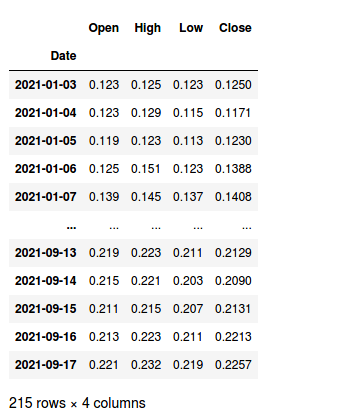
US2Y.index = US2Y.index.strftime('%Y/%m/%d')
で日付フォーマット変更
US2Y = US2Y.T
US2Y = US2Y.T.reset_index()
で
Date カラムを移動
chart =(
alt.Chart(US2Y)
.mark_line(opacity=0.8,clip=True)
.encode(
x="Date:T",
y=alt.Y("Close:Q",stack=None)
)
)
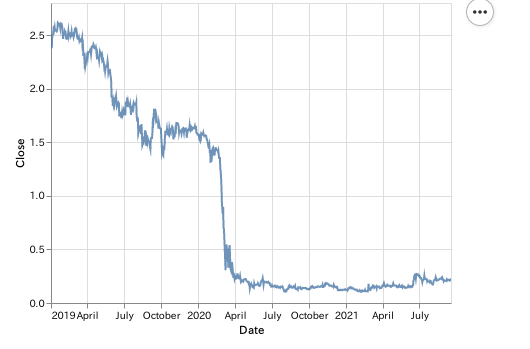
chart
で債権利回りをチャートで表示できる
同様に10年債も表示
US10Y = investpy.bonds.get_bond_historical_data(bond='U.S. 10Y',
                                               from_date='01/01/2019',
                                               to_date=today)
US10Y.index = US10Y.index.strftime('%Y/%m/%d')
US10Y = US10Y.T
US10Y = US10Y.T.reset_index()

us10 =(
    alt.Chart(US10Y)
    .mark_line(opacity=0.8,clip=True,color='Yellow')
    .encode(
        x="Date:T",
        y=alt.Y("Close:Q",stack=None)
    )
)
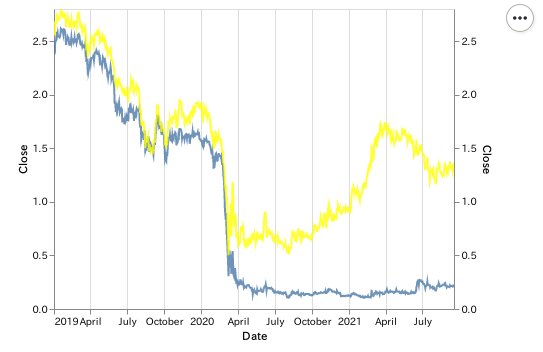
あとはチャートを重ねて表示するので
alt.layer(chart,us10).resolve_scale(
    y = 'independent'
)
とすると
2年債と10年債の2つのチャートが表示されるようになる

コメント