
python でWTI、金価格の表示 その2
investpy でも可能らしいので実線
https://investpy.readthedocs.io/_api/commodities.html
のリファレンスを見ながら実線
経済指標の取得のときには
investpy.economic_calendar()
を使い
economic_data = investpy.economic_calendar(time_zone=None, time_filter='time_only', countries=['japan', 'united states'], from_date='01/01/2021', to_date='11/06/2021')
で取得
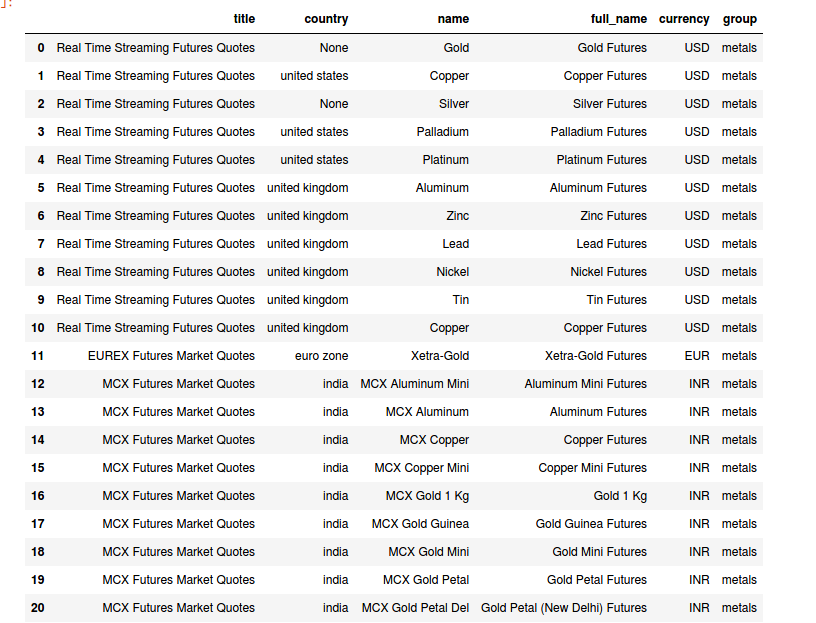
investpy.commodities.get_commodities(group=None)
で商品市場の情報が得られる
全部で66の行になる
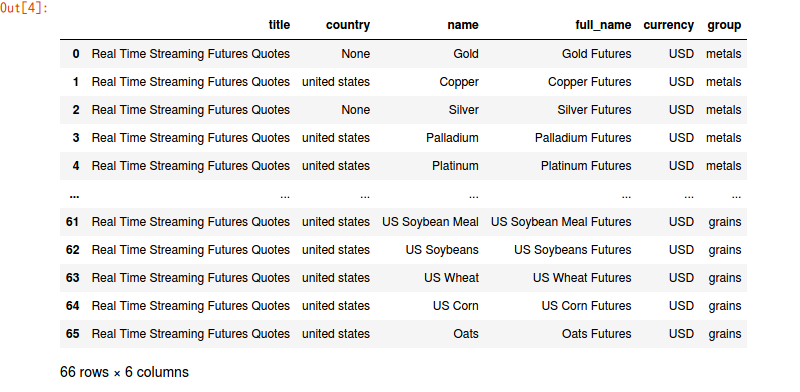
途中が省かれて表示されるので
commodity.head(35)
というようにすれば任意の場所まで表示できる
今回なら上から35まで表示
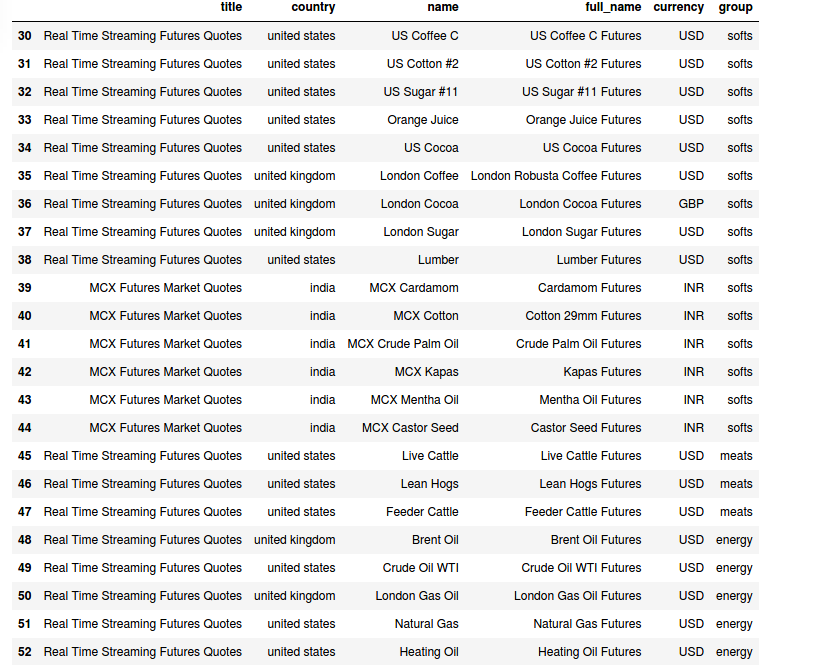
逆に最後から表示したいのなら
commodity.tail(36)
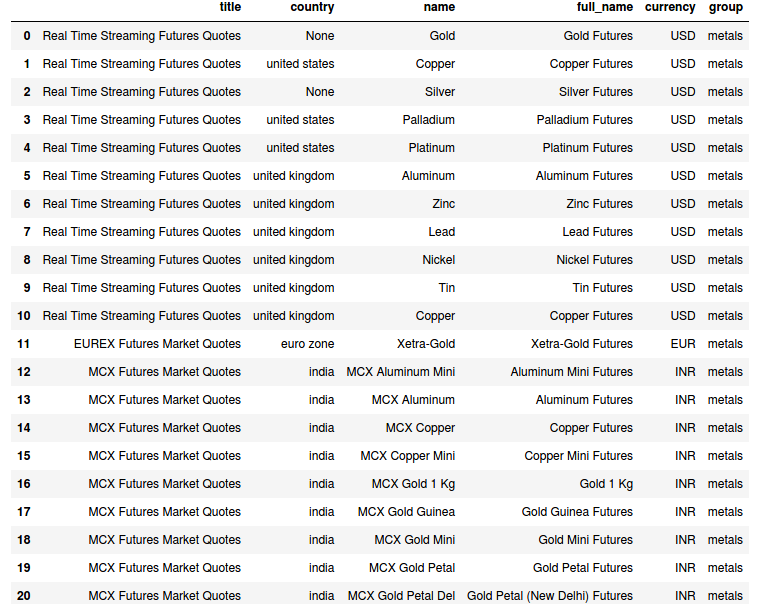
group の部分を指定すると絞り込みができる
金属にするなら
commodity = investpy.commodities.get_commodities(group="metals")
commodity
とすればOK
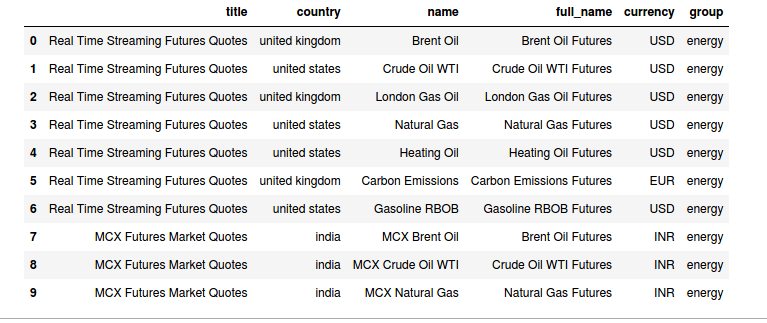
今回調べたいのはWTI、つまり原油の価格と金の価格なので
group を energy を指定
commodity = investpy.commodities.get_commodities(group="energy")
commodity
name が Crude Oil WTI のものが該当
金は金属なので
group に metails で絞り込む
commodity = investpy.commodities.get_commodities(group="metals")
commodity
この中で name が Gold のものが該当
次にチャートなどに必要なデータの取得
株価の取得方法については
【Python】investpyを使ったInvesting.comからのデータ取得方法
によれば
investpy.get_stock_historical_data()
で取得できる
ETFなら
investpy.get_etf_historical_data()
指数データなら
investpy.get_index_historical_data()
為替データなら
investpy.get_currency_cross_historical_data()
これらを元に
https://investpy.readthedocs.io/_api/commodities.html
をみると
investpy.commodities.get_commodity_recent_data()
なら最近のデータ
investpy.commodities.get_commodity_historical_data()
で直近のデータ
を取得できそう
構文は
investpy.commodities.get_commodity_historical_data(commodity, from_date, to_date, country=None, as_json=False, order='ascending', interval='Daily')
となっている
commodity には name カラムのものを当てはめる
from_date と to_date には日付を指定
フォーマットがdd/mm/yyyyなので注意
order は昇順、降順を指定
ascending は昇順
descending は降順
interval は取得するデータの間隔
デフォルトは daily
weekly や monthly にすることも可能
例が乗っていたので参考に
data = investpy.get_historical_data(commodity='gold', from_date='01/01/2018', to_date='01/01/2019')
としたがエラーとなる
---------------------------------------------------------------------------
AttributeError                            Traceback (most recent call last)
<ipython-input-11-69013139b965> in <module>
----> 1 data = investpy.get_historical_data(commodity='gold', from_date='01/01/2018', to_date='01/01/2019')

AttributeError: module 'investpy' has no attribute 'get_historical_data'
パラメータをしっかり設定して
gold =investpy.commodities.get_commodity_historical_data(commodity="Gold", from_date='01/01/2021', to_date='01/09/2021', country=None, as_json=False, order='ascending', interval='Daily')
gold
としたら成功
なお最近のデータであれば
data = investpy.get_commodity_recent_data(commodity='gold')
data
でも取得可能
期間は1ヶ月程度
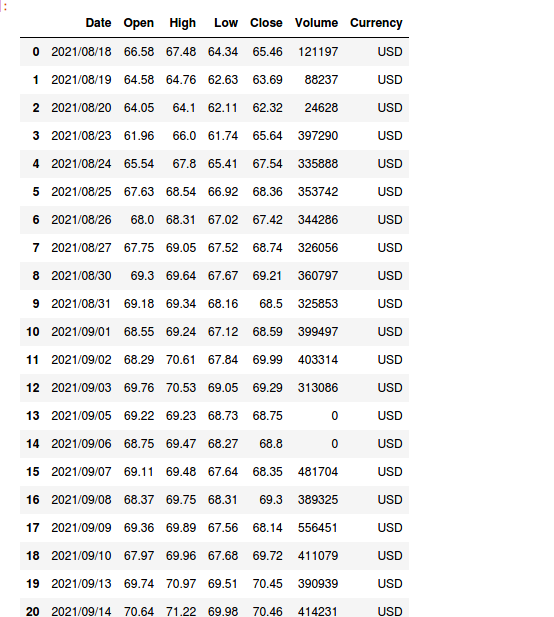
次に原油WTI
wti = investpy.get_commodity_recent_data(commodity='Crude Oil WTI')
wti
で取得可能
途中でvolume が0になっているところは市場がお休みの日

次に WTI の close の値を altair で表示
chart =(
    alt.Chart(wti)
    .mark_line(opacity=0.8,clip=True)
    .encode(
        x="date:T",
        y=alt.Y("close:Q",stack=None)
    )
)
chart
だと日付の形式の関係で表示されないので
日付形式を
wti['Date']=wti['Date'].str.replace('/','-')
としたが
---------------------------------------------------------------------------
KeyError                                  Traceback (most recent call last)
~/anaconda3/lib/python3.8/site-packages/pandas/core/indexes/base.py in get_loc(self, key, method, tolerance)
   3079             try:
-> 3080                 return self._engine.get_loc(casted_key)
   3081             except KeyError as err:

pandas/_libs/index.pyx in pandas._libs.index.IndexEngine.get_loc()

pandas/_libs/index.pyx in pandas._libs.index.IndexEngine.get_loc()

pandas/_libs/hashtable_class_helper.pxi in pandas._libs.hashtable.PyObjectHashTable.get_item()

pandas/_libs/hashtable_class_helper.pxi in pandas._libs.hashtable.PyObjectHashTable.get_item()

KeyError: 'Date'

The above exception was the direct cause of the following exception:

KeyError                                  Traceback (most recent call last)
<ipython-input-12-cf1271b5fd73> in <module>
----> 1 wti['Date']=wti['Date'].str.replace('/','-')

~/anaconda3/lib/python3.8/site-packages/pandas/core/frame.py in __getitem__(self, key)
   3022             if self.columns.nlevels > 1:
   3023                 return self._getitem_multilevel(key)
-> 3024             indexer = self.columns.get_loc(key)
   3025             if is_integer(indexer):
   3026                 indexer = [indexer]

~/anaconda3/lib/python3.8/site-packages/pandas/core/indexes/base.py in get_loc(self, key, method, tolerance)
   3080                 return self._engine.get_loc(casted_key)
   3081             except KeyError as err:
-> 3082                 raise KeyError(key) from err
   3083
   3084         if tolerance is not None:

KeyError: 'Date'
となる
wti.columns
で調べると
Index(['Open', 'High', 'Low', 'Close', 'Volume', 'Currency'], dtype='object')
となっているので
wti.reset_index()
で
Date をカラム側にする
これで
wti.index
とすると
DatetimeIndex(['2021-08-17', '2021-08-18', '2021-08-19', '2021-08-20',
               '2021-08-23', '2021-08-24', '2021-08-25', '2021-08-26',
               '2021-08-27', '2021-08-30', '2021-08-31', '2021-09-01',
               '2021-09-02', '2021-09-03', '2021-09-05', '2021-09-06',
               '2021-09-07', '2021-09-08', '2021-09-09', '2021-09-10',
               '2021-09-13', '2021-09-14', '2021-09-15', '2021-09-16',
               '2021-09-17'],
              dtype='datetime64[ns]', name='Date', freq=None)
となる
wti.index = wti.index.strftime('%Y/%m/%d')
で日付フォーマットを変更
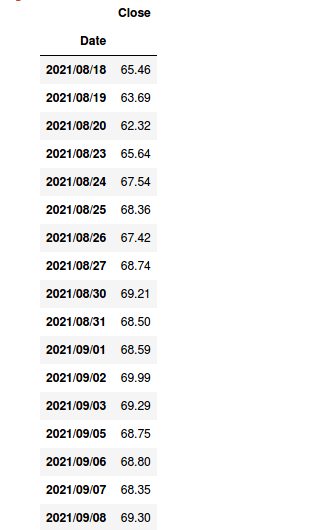
wti[['Close']]
とすれば Close のみに絞り込める
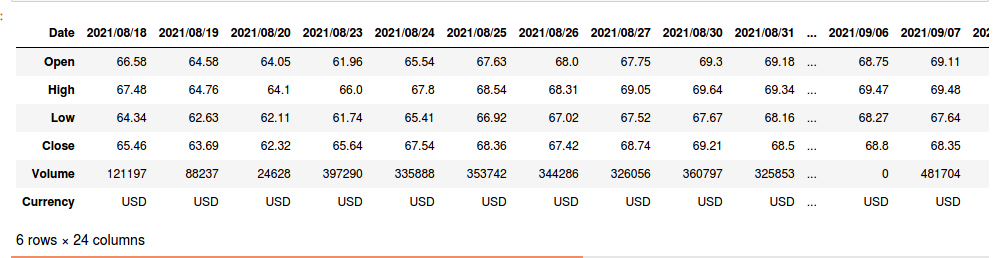
wti= wti.T
wti
とすれば配置を変更して
日付をカラムにできる
udemy の講習のときにはいくつか株のコードを取得したけど
今回はそれはいらない
wti= wti.T.reset_index()
を実行すると
Date が追加された状態のカラムができる
あとは
chart =(
    alt.Chart(wti)
    .mark_line(opacity=0.8,clip=True)
    .encode(
        x="Date:T",
        y=alt.Y("Close:Q",stack=None)
    )
)
chart
で折れ線グラフで WTI Close のグラフが作成できる
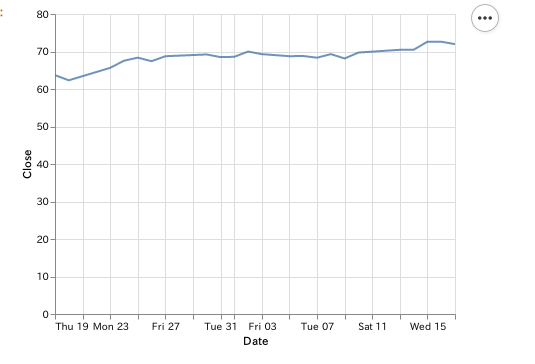
応用で金価格グラフも作成
gold =investpy.commodities.get_commodity_historical_data(commodity="Gold", from_date='01/01/2021', to_date='01/09/2021', country=None, as_json=False, order='ascending', interval='Daily')
gold
で年始から取得
gold.reset_index()
gold.index = gold.index.strftime('%Y/%m/%d')
で日付フォーマット変更
gold= gold.T
gold= gold.T.reset_index()
でカラムに Date を追加
chart =(
alt.Chart(gold)
.mark_line(opacity=0.8,clip=True)
.encode(
x="Date:T",
y=alt.Y("Close:Q",stack=None)
)
)
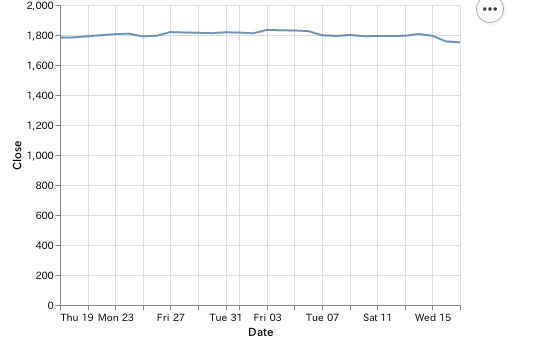
chart
でチャート表示
これで金価格も表示可能

コメント