webページをPDFにする

webページをPDFにする

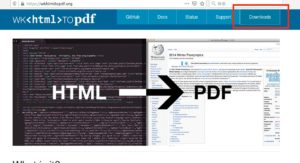
wkhtmltopdf
を使うとHTMLファイルをPDFにできる

これを python で使うライブラリが
pdfkit

この2つがあれば python をつかって
HTMLを PDF
に変換できる

インストールは pip を使う

pip install pdfkit 

でインストール

pdfkit のインポートは

import pdfkit

やることはスクレイピングと同じなので利用に注意

google のトップページをPDFにするなら

url ='https://www.google.com/'

PDFにするときにオプションをつけれる

options ={
    'page-size':'A4',
    'margin-top':'10',
    'margin-right':'10',
    'margin-left':'10',
    'margin-bottom':'10',
    'zoom':'1.0',
    'encoding':"UTF-8"
}

あとはPDF変換

pdfkit.from_url(url,'out.pdf',options=options)

エラーになるので調べたら
wkhtmltopdf
をインストール忘れていたので

これをインストールする

https://wkhtmltopdf.org/

Downloads をクリック

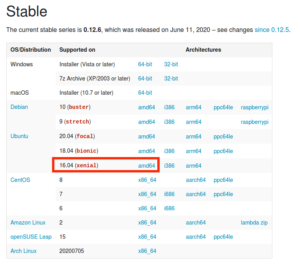
今回は ubuntu 16 なので
amd64 をクリック

ダウンロードして保存し

sudo dpkg -i wkhtmltox_0.12.6-1.xenial_amd64.deb 

を実行したが

wkhtmltox_0.12.6-1.xenial_amd64.deb を展開する準備をしています ...
wkhtmltox (1:0.12.6-1.xenial) を展開しています...
dpkg: 依存関係の問題により wkhtmltox の設定ができません:
 wkhtmltox は以下に依存 (depends) します: xfonts-75dpi ...しかし:
  パッケージ xfonts-75dpi はまだインストールされていません。

dpkg: パッケージ wkhtmltox の処理中にエラーが発生しました (--install):
 依存関係の問題 - 設定を見送ります
man-db (2.7.5-1) のトリガを処理しています ...
処理中にエラーが発生しました:
 wkhtmltox

となるため

sudo apt install xfonts-75dpi

でインストール後に

sudo dpkg -i wkhtmltox_0.12.6-1.xenial_amd64.deb 

で再度実行すると
インストールできた

pdfkit.from_url(url,'out.pdf',options=options)

でOK

すべてのwebページがレイアウトどおりPDFにできるわけではないので注意

サイトによっては
サイドバーがPDF化できていなかった

python で PDF 取り扱いライブラリのインストール

python で PDF 取り扱いライブラリのインストール

ReportLab・wkhtmltopdf / pdfkit・PyPDF2・pdfminer.six・tabula-py
を使えるようにする

python でPDF作成編集、テキスト、表の抽出をすることができるようになる

reportlab のインストールは
Pythonのreportlabの使い方まとめ

を参考に

pip install reportlab

を実行

WARNING: You are using pip version 21.2.4; however, version 21.3 is available.
You should consider upgrading via the '/home/snowpool/anaconda3/bin/python -m pip install --upgrade pip' command.

という警告がでたら
pip のアップデートが必要なので

python -m pip install --upgrade pip

で pip をアップデートする

pdfkit は

HTMLをPDFに変換するライブラリ「pdfkit」をインストールする

を参考に

pip install pdfkit

でインストール

次に PyPDF2

【Python】「PyPDF2ライブラリ」によるPDFファイルの結合・分割と画像の抽出

を参考にインストール

pip だと画像の抽出に一部欠陥があるため
Github のインストーラーがおすすめらしい

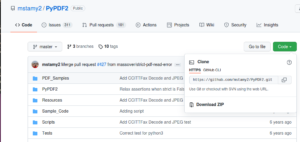
https://github.com/mstamy2/PyPDF2
へアクセス

Code をクリックすると
Download ZIP がでるので
これでダウンロード

unzip PyPDF2-master.zip

で解凍して

cd PyPDF2-master/
python setup.py install

でインストール

pdfminer.six は
【Python】pdfminer.six:PDFからテキストを取得・抽出する

を参考に

pip install pdfminer.six

でインストール

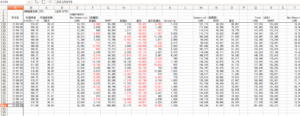
【自動化】PDFの表をExcelへ(Python)

を参考に

pip install tabula-py

次に
pyinstaller

pyinstallerインストール ( Python3, Ubuntu 20.04 )

を参考に

pip3 install pyinstaller

でインストール

ubuntu で Adobe Acrobat Reader インストール

snap でインストールしたが
動作しないため一度アンインストールする

snapパッケージのアンインストール

を参考に

sudo snap remove acrordrdc

で削除

UbuntuにAdobe Acrobat Readerを入れる

を参考に

wget -O ~/adobe.deb ftp://ftp.adobe.com/pub/adobe/reader/unix/9.x/9.5.5/enu/AdbeRdr9.5.5-1_i386linux_enu.deb

でパッケージ取得

sudo dpkg --add-architecture i386 
sudo apt update


i386アーキテクチャ有効化

インストールに必要なライブラリをいれる

sudo dpkg -i ~/adobe.deb

でインストール

このまま

acroread

で起動できるけど
言語が英語になる

日本語対応するので

wget http://ardownload.adobe.com/pub/adobe/reader/unix/9.x/9.1/misc/FontPack910_jpn_i486-linux.tar.bz2

tar xavf FontPack910_jpn_i486-linux.tar.bz2
sudo bash ./JPNKIT/INSTALL

でインストールできる

Welcome to the Asian Language Kit installation.
This installation will not work if you do not have the Unix Adobe Reader version 9.1 installed prior to this installation.
If you do not have Adobe Reader version 9.1 already installed on your system please do so before installing this Asian Language Kit.
Continue installation?  [y]

となるので
y

The font software contained in this package is being licensed to you solely
for use with the Adobe Reader product ("Adobe Reader") subject to
the terms and conditions of the Electronic End User License Agreement
accompanying the Adobe Reader.

Please type  "accept"  to accept the terms and conditions of license agreement; Type  "decline"  to exit. 

でライセンスに同意なので
accept

Enter the location where you installed the Adobe Reader [/opt] 

はインストール場所
そのまま
Enter

これで一応起動はできるようになった

How to Install Adobe Acrobat Reader on Ubuntu 20.04 Focal Fossa Linux

にあるように
バージョンが古くリスクがあるため
pyautogui のテスト以降は別のものを利用することにする

なお

which acroread 

でパスを調べたら

/usr/bin/acroread

となっていた

ubuntu で Adobe Acrobat Reader DC と Tesseract OCRインストール

ubuntu で Adobe Acrobat Reader DCインストール

Install acrordrdcon Ubuntu

を参考に

sudo apt update
sudo apt install snapd
sudo snap install acrordrdc

でインストール

次に
pyperclip のインストール

PythonのPyperclipモジュールでテキストをコピーして貼り付ける

を参考に

pip install pyperclip

TesseractOCR
をインストール

Tesseract OCR のインストール(Ubuntu 上)

を参考に
実行しようとしたがパッケージがないとなるので

OCRエンジンTesseractをUbuntuインストールして文字画像を認識させてみた

を参考に

sudo add-apt-repository ppa:alex-p/tesseract-ocr
sudo apt-get update

でリポジトリの追加と更新

sudo apt install tesseract-ocr
sudo apt install libtesseract-dev

で Tesseract のインストール

tesseract -v

でバージョンを確認

tesseract 4.1.1-rc2-37-gc1a5
 leptonica-1.78.0
  libgif 5.1.4 : libjpeg 8d (libjpeg-turbo 1.4.2) : libpng 1.2.54 : libtiff 4.0.6 : zlib 1.2.8 : libwebp 0.4.4 : libopenjp2 2.1.2
 Found AVX
 Found SSE
 Found libarchive 3.1.2

となっているのを確認できる

続いて訓練済モデルのインストール

sudo apt install tesseract-ocr-jpn tesseract-ocr-jpn-vert
sudo apt install tesseract-ocr-script-jpan tesseract-ocr-script-jpan-vert

実行後インストールの確認

tesseract --list-langs

を実行し

List of available languages (6):
Japanese
Japanese_vert
eng
jpn
jpn_vert
osd

となればOK

なお Github で日本語データがあり
そっちをダウンロードしてやるほうほうが
ubuntuで画像から日本語OCRでテキスト抽出

に掲載されているので
もし日本語対応が微妙な場合こちらを試したほうがいいかもしれない

次に pyocr のインストール

python3でPyOCRを使って画像を文字列に変換する方法

を参考に

pip install pyocr

でインストール

pyocr の ver0.8 から以前にあったバグが解消されているため
エラー箇所の修正は不要らしい

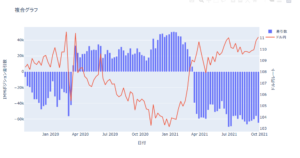
python でIMMポジショングラフ表示

python でIMMポジショングラフ表示

【第35回PYTHON講座】plotlyで複合グラフの作成


IMMポジションをグラフ表示するのがあったので実践

plotly を使うので

!pip install plotly

でインストール

使用するIMMポジションデータについては
外為どっとこむからダウンロード可能

https://www.gaitame.com/markets/imm/

xls ファイルをダウンロード

https://www.gaitame.com/market/imm/imm_currency.xls
がリンク先なので
wget を cron で毎週火曜日に取得するように設定すると楽かもしれない

内容は毎週火曜日に更新されている

ubuntu なので
Excel ではなく LibreOffice で代用

使用するシートは
IMMyen になる

この中で使用するセルは
日付
IMMポジション数差引
となる

まずはライブラリをインポート

import pandas as pd
import plotly

次にファイルを jupyter notebook で
immcurrency.xls
をアップロードし

xlsfile = "imm_currency.xls"

でファイルを読み込む

df_a = pd.read_excel(xlsfile, sheet_name="IMMyen", usecols=[0, 8])
df_b = pd.read_excel(xlsfile, sheet_name="IMMyen", usecols=[0, 1])

で usecols を使い抽出する列を指定
df_a には差引
df_b にはドル円レート
を格納している

0がA列になり8がI列になっている

1はB列になる

数えるときには0からなので注意

df1 = df_a[50:len(df_a)]
df2 = df_b[50:len(df_b)]

で50行目から終わりまでを指定

次に棒グラフの設定

graph1 = plotly.graph_objs.Bar(
x=df1.iloc[:, 0],
y=df1.iloc[:, 1],
yaxis="y1",
name="差引数"
)

graph_objs.Bar が棒グラフの設定になる

x=df1.iloc[:, 0],
y=df1.iloc[:, 1],

でどの列を対象にするのか視程している
0が日付
1が差引の数になる

yaxis="y1",

でy軸の名称をつけて識別できるようにする

次に折れ線グラフ

graph2 = plotly.graph_objs.Scatter(
x=df2.iloc[:, 0],
y=df2.iloc[:, 1],
yaxis="y2",
name="ドル円"
)

次に余白設定

adjust1 = (df1.iloc[:, 1].max() - df1.iloc[:, 1].min())/10 / 2
adjust2 = (df2.iloc[:, 1].max() - df2.iloc[:, 1].min())/10 / 2

adjust1、adjust2はそれぞれのY軸の最大値、最小値の差の20分の1を定義

これでグラフ表示のときにY軸上下に余白をつけることができる

次に複号グラフの位置の設定

layout = plotly.graph_objs.Layout(

    title="複合グラフ",

    xaxis=dict(title="日付"),

    yaxis=dict(
        title="IMMポジション差引数",
        range=[df1.iloc[:, 1].min() - adjust1, df1.iloc[:, 1].max() + adjust1]),

    yaxis2=dict(
        title="ドル円レート",
        range=[df2.iloc[:, 1].min() - adjust2, df2.iloc[:, 1].max() + adjust2],
        overlaying="y1", side="right", showgrid=False)

)

これは
graph_objs.Layout で設定する

range でy軸の高さ

overlaying は上に表示するときに使う

今回は

overlaying="y1"

を折れ線グラフで設定しているので
棒グラフの上に折れ線グラフがでる

side="right"

とすると
右側にy軸の値がでる

こうすることで2つのy軸表示がでる
デフォルトは左にでる

showgrid=False

を指定すると
グリッドが表示されなくなる

これがあるとグリッド線が表示されてわかりにくくなるので
今回は false にしている

あとは複号グラフの表示

data = [graph1, graph2]
fig = plotly.graph_objs.Figure(data=data, layout=layout)
fig.show()

data に表示するものを指定[/python]
graph_objs.Figure() [/python]
でデータとレイアウトをセット

show() 

で表示する

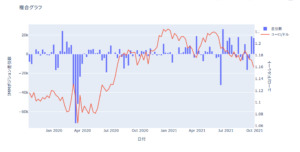
次に別の通貨で応用
ユーロドルで実践

imm_euro =  pd.read_excel(xlsfile, sheet_name="IMMeuro", usecols=[0, 8])
euro_rate = pd.read_excel(xlsfile, sheet_name="IMMeuro", usecols=[0, 1])

でユーロドルのシートからデータ取得

imm_euro_data = imm_euro[50:len(df_a)]
euro_rate_data = euro_rate[50:len(df_b)]

でデータを50行目からに絞り込む

imm_graph = plotly.graph_objs.Bar(
x=imm_euro_data.iloc[:, 0],
y=imm_euro_data.iloc[:, 1],
yaxis="y1",
name="差引数"
)
euro_graph = plotly.graph_objs.Scatter(
x=euro_rate_data.iloc[:, 0],
y=euro_rate_data.iloc[:, 1],
yaxis="y2",
name="ドル円"
)

でそれぞれのデータをグラフにセット

adjust1 = (imm_euro_data.iloc[:, 1].max() - imm_euro_data.iloc[:, 1].min())/10 / 2
adjust2 = (euro_rate_data.iloc[:, 1].max() - euro_rate_data.iloc[:, 1].min())/10 / 2

で余白を設定してグラフ表示を見やすくする

layout = plotly.graph_objs.Layout(

    title="複合グラフ",

    xaxis=dict(title="日付"),

    yaxis=dict(
        title="IMMポジション差引数",
        range=[imm_euro_data.iloc[:, 1].min() - adjust1, imm_euro_data.iloc[:, 1].max() + adjust1]),

    yaxis2=dict(
        title="ユーロ/ドルレート",
        range=[euro_rate_data.iloc[:, 1].min() - adjust2, euro_rate_data.iloc[:, 1].max() + adjust2],
        overlaying="y1", side="right", showgrid=False)

)


複号グラフの設定

data = [imm_graph, euro_graph]
fig = plotly.graph_objs.Figure(data=data, layout=layout)
fig.show()


データ表示

これでユーロドルでの
IMMポジションの比率
ユーロドルの現状がわかりやすくなる

python で株価指数の取得その2

python で株価指数の取得その2

日経平均株価とかダウはよくテレビとかででるけど
フランスとかイギリスなどのはネットで調べる必要があり
アプリなどでもあまりでないことが多いので表示できるように
investpy で実験

import investpy
from datetime import datetime, date, timedelta
from dateutil.relativedelta import relativedelta
import altair as alt
import pandas as pd

でライブラリをインポート

today = datetime.today().strftime('%d/%m/%Y')

で今日の日付を取得し
フォーマットを investpy で使う日付に変更

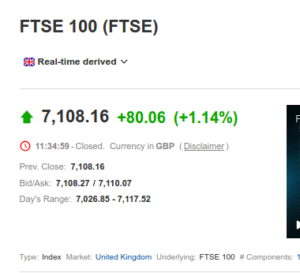
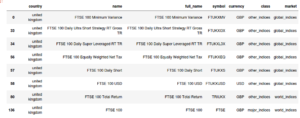
今回はイギリスの指標の
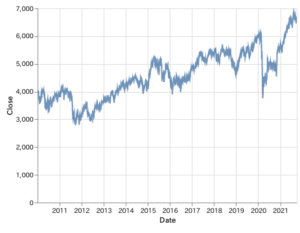
FTSE 100

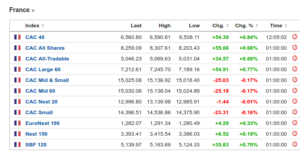
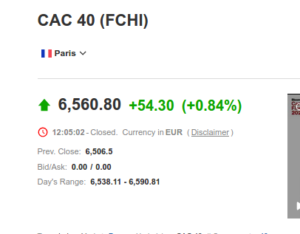
フランスの
CAC 40

を取得

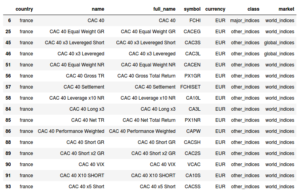
フランスは
france

イギリスは
united kingdom
が国名になるので

uk_index =investpy.indices.get_indices(country="united kingdom")
f_index =investpy.indices.get_indices(country="france")

で取得して

uk_index[uk_index['full_name'].str.contains('FTSE 100')]

で検索し 
name が FTSE 100 を確認

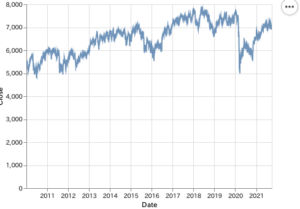
ftse = investpy.get_index_historical_data(index='FTSE 100',country='united kingdom',
                                        from_date='01/01/2010',to_date=today)

でFTSE 100の値を取得し

ftse.index = ftse.index.strftime('%Y/%m%d')
ftse = ftse.T
ftse = ftse.T.reset_index()

でDateをカラムに追加

chart =(
    alt.Chart(ftse)
    .mark_line(opacity=0.8,clip=True)
    .encode(
        x="Date:T",
        y=alt.Y("Close:Q",stack=None)
    )
)
chart

でチャートで表示

次にCAC 40

f_index[f_index['full_name'].str.contains('CAC 40')]

で検索

cac40 = investpy.get_index_historical_data(index='CAC 40',country='france',
                                        from_date='01/01/2010',to_date=today)

で値を取得

cac40.index = cac40.index.strftime('/%Y/%m/%d')
cac40 = cac40.T
cac40 = cac40.T.reset_index()

で日付フォーマット変更と
Date をカラムに追加

chart =(
    alt.Chart(cac40)
    .mark_line(opacity=0.8,clip=True)
    .encode(
        x="Date:T",
        y=alt.Y("Close:Q",stack=None)
    )
)
chart

でチャート表示

他にもアジアや中東などの株価指数なども
おなじ要領で調べてグラフ化が可能

python で株価指数の取得

python で株価指数の取得
【Python】investpyを使ったInvesting.comからのデータ取得方法


指数データの取得方法が乗っていたので参考に
import investpy
from datetime import datetime, date, timedelta
from dateutil.relativedelta import relativedelta
import altair as alt
import pandas as pd

でライブラリをインポート

today = datetime.today().strftime('%d/%m/%Y')

で今日の日付を取得し
フォーマットを investpy で使う日付に変更

df = investpy.get_index_historical_data(index='S&P 500',country='united states',
                                        from_date='01/01/2010',to_date=today)


2010年1月1日から今日までの
S&P500
のデータを取得

df.index = df.index.strftime('%Y/%m/%d')

で日付フォーマットを altair で使う形式に変更

df = df.T
df= df.T.reset_index()

でDate をカラムに追加

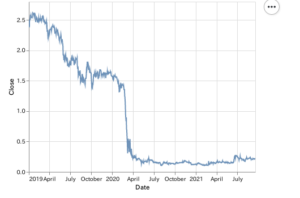
chart =(
    alt.Chart(df)
    .mark_line(opacity=0.8,clip=True)
    .encode(
        x="Date:T",
        y=alt.Y("Close:Q",stack=None)
    )
)
chart

でチャートを表示

S&P500 ができたのでダウ平均を取得

使用したメソッドの
get_index_historical_data
については
investpy.indices

を参考に

パラメータに指定する株価指数については
https://jp.investing.com/indices/world-indices
で日本語版がでるがコードを指定するので

https://www.investing.com/indices/usa-indices
を参考に

dow =  investpy.get_index_historical_data(index='Dow Jones',country='united states',
                                        from_date='01/01/2010',to_date=today)

としたが

---------------------------------------------------------------------------
RuntimeError                              Traceback (most recent call last)
<ipython-input-23-37a90ad00d34> in <module>
----> 1 dow =  investpy.get_index_historical_data(index='DJI',country='united states',
      2                                         from_date='01/01/2010',to_date=today)

~/anaconda3/lib/python3.8/site-packages/investpy/indices.py in get_index_historical_data(index, country, from_date, to_date, as_json, order, interval)
    511 
    512     if index not in list(indices['name'].apply(unidecode).str.lower()):
--> 513         raise RuntimeError("ERR#0045: index " + index + " not found, check if it is correct.")
    514 
    515     full_name = indices.loc[(indices['name'].apply(unidecode).str.lower() == index).idxmax(), 'full_name']

RuntimeError: ERR#0045: index dji not found, check if it is correct.

となり
指定するコードが違うらしい

VIX 指数(恐怖指数)については

vix = investpy.get_index_historical_data(index='S&P 500 VIX',country='united states',
                                        from_date='01/01/2010',to_date=today)
vix

とすれば表示される

どうやら名称が違うようなので
プライマリーセクターに絞り検索

stock_index =investpy.indices.get_indices(country="united states")
stock_index[stock_index['class']=='primary_sectors']

64に絞りこみできるので

stock_index =investpy.indices.get_indices(country="united states")
stock_index[stock_index['class']=='primary_sectors'].head(35)


stock_index =investpy.indices.get_indices(country="united states")
stock_index[stock_index['class']=='primary_sectors'].tail(35)

で探すが該当するものがでない

pandasで特定の文字列を含む行を抽出(完全一致、部分一致)

で部分一致で検索をする

str.startswith()

で文字列で始まるもの
もしくは

str.contains()

で文字列を含むもの
を対象にする

dow =stock_index[(stock_index['market']=='global_indices') & (stock_index['class']=='other_indices')]
dow[dow['name'].str.contains('DJ')]

で探したがそれらしいものはでてこない

stock_index =investpy.indices.get_indices(country="united states")
stock_index[stock_index['full_name'].str.contains('Dow Jones Industrial')]

で検索すると
Dow 30 が表示される

dow =  investpy.get_index_historical_data(index='Dow 30',country='united states',
                                        from_date='01/01/2010',to_date=today)
dow

で表示されるので
S&P500のときと同じようにチャートを表示する

dow=dow.T
dow = dow.T.reset_index()

で Date をカラムに追加

chart =(
    alt.Chart(dow)
    .mark_line(opacity=0.8,clip=True)
    .encode(
        x="Date:T",
        y=alt.Y("Close:Q",stack=None)
    )
)
chart

でチャート表示

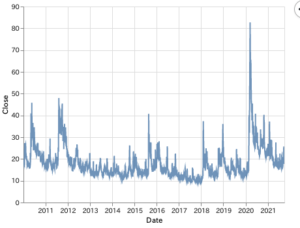
vix 恐怖指数をチャートにするなら

vix = investpy.get_index_historical_data(index='S&P 500 VIX',country='united states',
                                        from_date='01/01/2010',to_date=today)

でデータを取得

vix = vix.T
vix = vix.T.reset_index()


Date をカラムに追加

chart =(
    alt.Chart(vix)
    .mark_line(opacity=0.8,clip=True)
    .encode(
        x="Date:T",
        y=alt.Y("Close:Q",stack=None)
    )
)
chart

でチャートで表示

他の国の株価指数も取得できる
その場合、国の指定をする必要があり

investpy.indices.get_index_countries()

で取得可能な国が表示できる

index_list = investpy.indices.get_index_countries()
index_list

で取得可能な国を表示可能

ユーロ圏の株価指数を調べるのなら
https://www.investing.com/indices/european-indices

株価指数の名前を調べる
ダウ平均が Dow 30 というように
名称が investpy のときわからないときがあるので

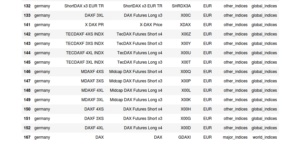
DAX
Euro Stoxx 50
がある国を調べる

Germany なので

euro_index =investpy.indices.get_indices(country="germany")

で取得し
https://www.investing.com/indices/germany-30
から
名称が DAX(GDAXI)
であるのを確認したら

euro_index[euro_index['full_name'].str.contains('DAX')]

で探すと出てこないので

euro_index[euro_index['name'].str.contains('DAX')]

で検索すると出てきた

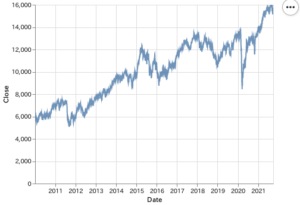
あとは

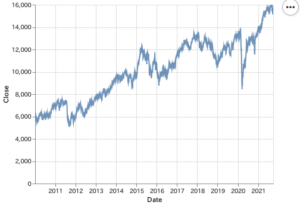
dax = investpy.get_index_historical_data(index='DAX',country='germany',
                                        from_date='01/01/2010',to_date=today)

でDAXの値を取得

dax.index = dax.index.strftime('%Y/%m/%d')
dax = dax.T
dax = dax.T.reset_index()

で日付フォーマット変更と
Date をカラムに追加

chart =(
    alt.Chart(dax)
    .mark_line(opacity=0.8,clip=True)
    .encode(
        x="Date:T",
        y=alt.Y("Close:Q",stack=None)
    )
)
chart

でチャート表示

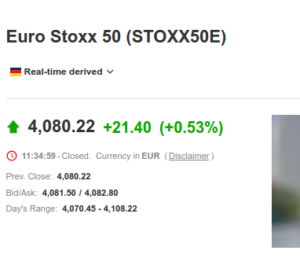
応用でユーロストック50なら
https://www.investing.com/indices/eu-stoxx50

Euro Stoxx 50 (STOXX50E)
となっているのを確認できるので

euro_index =investpy.indices.get_indices(country="germany")
euro_index[euro_index['name'].str.contains('Euro Stoxx 50')]

で検索すると簡単にヒットする

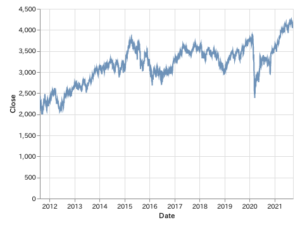
あとは

euro_stock50 = investpy.get_index_historical_data(index='Euro Stoxx 50',country='germany',
                                        from_date='01/01/2010',to_date=today)

euro_stock50.index = euro_stock50.index.strftime('%Y/%m/%d')
euro_stock50 = euro_stock50.T
euro_stock50 = euro_stock50.T.reset_index()

chart =(
    alt.Chart(euro_stock50)
    .mark_line(opacity=0.8,clip=True)
    .encode(
        x="Date:T",
        y=alt.Y("Close:Q",stack=None)
    )
)
chart

で表示できる

python で債権利回りの表示

python で債権利回りの表示

債権は

https://investpy.readthedocs.io/_api/bonds.html
で取得できそう

ただし、債権利回りがでてないので検索

債権利回りコードは
https://stackoverflow.com/questions/65063436/pulling-yields-data-from-investpy-package
を参考に

import investpy
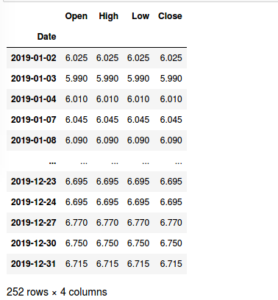
data = investpy.bonds.get_bond_historical_data(bond='South Africa 2Y',
                                               from_date='01/01/2019',
                                               to_date='31/12/2019')
data

で南アフリカ2年債の利回りを表示可能

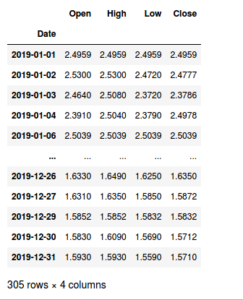
米国債の2年債の利回りなら

data = investpy.bonds.get_bond_historical_data(bond='U.S. 2Y',
                                               from_date='01/01/2019',
                                               to_date='31/12/2019')

data

でOK

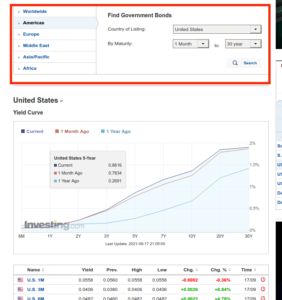
債権の国コードや種類については
https://za.investing.com/rates-bonds/world-government-bonds?maturity_from=10&maturity_to=310
で調べることができる

Find Government Bonds

Country of Listing で国を選べば
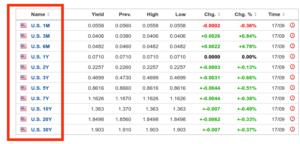
チャートの下のほうに債権の種類が表示されるので
これをもとに
米国債2年なら
U.S. 2Y
となる

altair で表示するなら
商品市場でWTI、金価格のときにやったのと同じように
行う

今回は日付を date で取得し
年始から今日までの米国債2年債の利回りチャートを表示

from datetime import datetime, date, timedelta
from dateutil.relativedelta import relativedelta

today = datetime.today().strftime('%d/%m/%Y')
today

で今日の日付を取得

US2Y = investpy.bonds.get_bond_historical_data(bond='U.S. 2Y',
                                               from_date='01/01/2021',
                                               to_date=today)
US2Y

で年始から今日までの利回りを取得

US2Y.index = US2Y.index.strftime('%Y/%m/%d')

で日付フォーマット変更

US2Y = US2Y.T
US2Y = US2Y.T.reset_index()


Date カラムを移動

chart =(
    alt.Chart(US2Y)
    .mark_line(opacity=0.8,clip=True)
    .encode(
        x="Date:T",
        y=alt.Y("Close:Q",stack=None)
    )
)
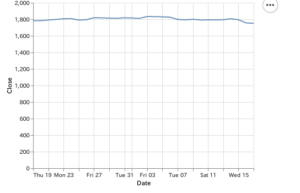
chart

で債権利回りをチャートで表示できる

同様に10年債も表示

US10Y = investpy.bonds.get_bond_historical_data(bond='U.S. 10Y',
                                               from_date='01/01/2019',
                                               to_date=today)
US10Y.index = US10Y.index.strftime('%Y/%m/%d')
US10Y = US10Y.T
US10Y = US10Y.T.reset_index()

us10 =(
    alt.Chart(US10Y)
    .mark_line(opacity=0.8,clip=True,color='Yellow')
    .encode(
        x="Date:T",
        y=alt.Y("Close:Q",stack=None)
    )
)

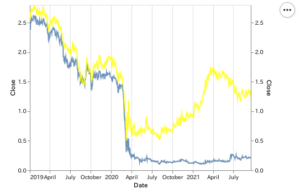
あとはチャートを重ねて表示するので

alt.layer(chart,us10).resolve_scale(
    y = 'independent'
)

とすると
2年債と10年債の2つのチャートが表示されるようになる

python でWTI、金価格の表示

python でWTI、金価格の表示 その2

investpy でも可能らしいので実線

https://investpy.readthedocs.io/_api/commodities.html
のリファレンスを見ながら実線

経済指標の取得のときには

investpy.economic_calendar()

を使い

economic_data = investpy.economic_calendar(time_zone=None, time_filter='time_only', countries=['japan', 'united states'], from_date='01/01/2021', to_date='11/06/2021')

で取得

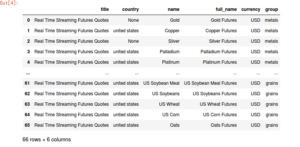
investpy.commodities.get_commodities(group=None)

で商品市場の情報が得られる

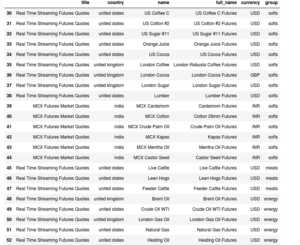
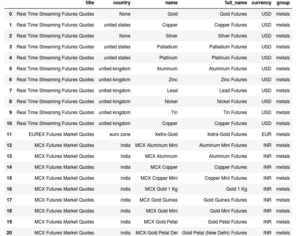
全部で66の行になる

途中が省かれて表示されるので

commodity.head(35)

というようにすれば任意の場所まで表示できる

今回なら上から35まで表示

逆に最後から表示したいのなら

commodity.tail(36)

group の部分を指定すると絞り込みができる

金属にするなら

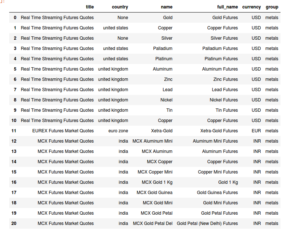
commodity = investpy.commodities.get_commodities(group="metals")
commodity

とすればOK

今回調べたいのはWTI、つまり原油の価格と金の価格なので

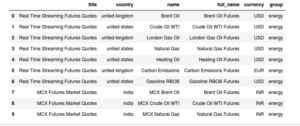
group を energy を指定

commodity = investpy.commodities.get_commodities(group="energy")
commodity

name が Crude Oil WTI のものが該当

金は金属なので
group に metails で絞り込む

commodity = investpy.commodities.get_commodities(group="metals")
commodity

この中で name が Gold のものが該当

次にチャートなどに必要なデータの取得

株価の取得方法については
【Python】investpyを使ったInvesting.comからのデータ取得方法

によれば

investpy.get_stock_historical_data()

で取得できる

ETFなら

 investpy.get_etf_historical_data()

指数データなら

investpy.get_index_historical_data()

為替データなら

investpy.get_currency_cross_historical_data()

これらを元に
https://investpy.readthedocs.io/_api/commodities.html
をみると

investpy.commodities.get_commodity_recent_data()

なら最近のデータ

investpy.commodities.get_commodity_historical_data()

で直近のデータ
を取得できそう

構文は

investpy.commodities.get_commodity_historical_data(commodity, from_date, to_date, country=None, as_json=False, order='ascending', interval='Daily')

となっている

commodity には name カラムのものを当てはめる
from_date と to_date には日付を指定
フォーマットがdd/mm/yyyyなので注意

order は昇順、降順を指定
ascending は昇順
descending は降順

interval は取得するデータの間隔
デフォルトは daily
weekly や monthly にすることも可能

例が乗っていたので参考に
data = investpy.get_historical_data(commodity='gold', from_date='01/01/2018', to_date='01/01/2019')

としたがエラーとなる

---------------------------------------------------------------------------
AttributeError                            Traceback (most recent call last)
<ipython-input-11-69013139b965> in <module>
----> 1 data = investpy.get_historical_data(commodity='gold', from_date='01/01/2018', to_date='01/01/2019')

AttributeError: module 'investpy' has no attribute 'get_historical_data'

パラメータをしっかり設定して

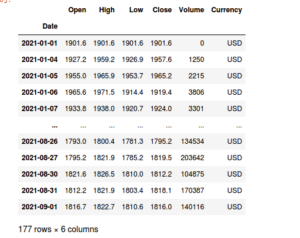
gold =investpy.commodities.get_commodity_historical_data(commodity="Gold", from_date='01/01/2021', to_date='01/09/2021', country=None, as_json=False, order='ascending', interval='Daily')
gold

としたら成功

なお最近のデータであれば

data = investpy.get_commodity_recent_data(commodity='gold')
data

でも取得可能
期間は1ヶ月程度

次に原油WTI

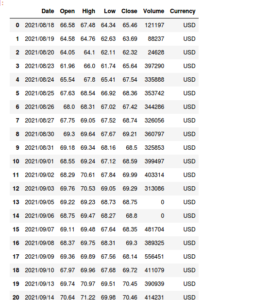
wti = investpy.get_commodity_recent_data(commodity='Crude Oil WTI')
wti

で取得可能

途中でvolume が0になっているところは市場がお休みの日

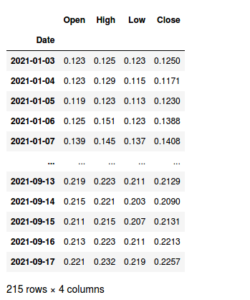
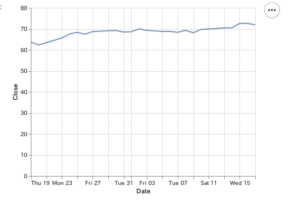
次に WTI の close の値を altair で表示

chart =(
    alt.Chart(wti)
    .mark_line(opacity=0.8,clip=True)
    .encode(
        x="date:T",
        y=alt.Y("close:Q",stack=None)
    )
)
chart

だと日付の形式の関係で表示されないので
日付形式を

wti['Date']=wti['Date'].str.replace('/','-')

としたが

---------------------------------------------------------------------------
KeyError                                  Traceback (most recent call last)
~/anaconda3/lib/python3.8/site-packages/pandas/core/indexes/base.py in get_loc(self, key, method, tolerance)
   3079             try:
-> 3080                 return self._engine.get_loc(casted_key)
   3081             except KeyError as err:

pandas/_libs/index.pyx in pandas._libs.index.IndexEngine.get_loc()

pandas/_libs/index.pyx in pandas._libs.index.IndexEngine.get_loc()

pandas/_libs/hashtable_class_helper.pxi in pandas._libs.hashtable.PyObjectHashTable.get_item()

pandas/_libs/hashtable_class_helper.pxi in pandas._libs.hashtable.PyObjectHashTable.get_item()

KeyError: 'Date'

The above exception was the direct cause of the following exception:

KeyError                                  Traceback (most recent call last)
<ipython-input-12-cf1271b5fd73> in <module>
----> 1 wti['Date']=wti['Date'].str.replace('/','-')

~/anaconda3/lib/python3.8/site-packages/pandas/core/frame.py in __getitem__(self, key)
   3022             if self.columns.nlevels > 1:
   3023                 return self._getitem_multilevel(key)
-> 3024             indexer = self.columns.get_loc(key)
   3025             if is_integer(indexer):
   3026                 indexer = [indexer]

~/anaconda3/lib/python3.8/site-packages/pandas/core/indexes/base.py in get_loc(self, key, method, tolerance)
   3080                 return self._engine.get_loc(casted_key)
   3081             except KeyError as err:
-> 3082                 raise KeyError(key) from err
   3083 
   3084         if tolerance is not None:

KeyError: 'Date'

となる

wti.columns

で調べると

Index(['Open', 'High', 'Low', 'Close', 'Volume', 'Currency'], dtype='object')

となっているので

wti.reset_index()


Date をカラム側にする

これで

wti.index

とすると

DatetimeIndex(['2021-08-17', '2021-08-18', '2021-08-19', '2021-08-20',
               '2021-08-23', '2021-08-24', '2021-08-25', '2021-08-26',
               '2021-08-27', '2021-08-30', '2021-08-31', '2021-09-01',
               '2021-09-02', '2021-09-03', '2021-09-05', '2021-09-06',
               '2021-09-07', '2021-09-08', '2021-09-09', '2021-09-10',
               '2021-09-13', '2021-09-14', '2021-09-15', '2021-09-16',
               '2021-09-17'],
              dtype='datetime64[ns]', name='Date', freq=None)

となる

wti.index = wti.index.strftime('%Y/%m/%d')

で日付フォーマットを変更

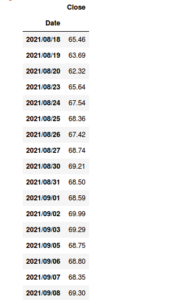
wti[['Close']]

とすれば Close のみに絞り込める

wti= wti.T
wti

とすれば配置を変更して
日付をカラムにできる

udemy の講習のときにはいくつか株のコードを取得したけど
今回はそれはいらない

wti= wti.T.reset_index()

を実行すると
Date が追加された状態のカラムができる

あとは

chart =(
    alt.Chart(wti)
    .mark_line(opacity=0.8,clip=True)
    .encode(
        x="Date:T",
        y=alt.Y("Close:Q",stack=None)
    )
)
chart

で折れ線グラフで WTI Close のグラフが作成できる

応用で金価格グラフも作成

gold =investpy.commodities.get_commodity_historical_data(commodity="Gold", from_date='01/01/2021', to_date='01/09/2021', country=None, as_json=False, order='ascending', interval='Daily')
gold

で年始から取得

gold.reset_index()
gold.index = gold.index.strftime('%Y/%m/%d')

で日付フォーマット変更

gold= gold.T
gold= gold.T.reset_index()

でカラムに Date を追加

chart =(
    alt.Chart(gold)
    .mark_line(opacity=0.8,clip=True)
    .encode(
        x="Date:T",
        y=alt.Y("Close:Q",stack=None)
    )
)
chart

でチャート表示

これで金価格も表示可能

ラズパイゼロでドラレコもどきを作成

ラズパイゼロでドラレコもどきを作成

音声なしで動画と画像のみを撮影し
Google Drive に保存するようにする予定

なおセットアップには
microSD 以外に
HDMI と USB の変換するものがないと
microUSB しかコネクタがないので
モニターとマウスをつけれないので注意

以前はNOOBSでインストールしていたけど
最近では
Raspberry Pi Imager
を使うのが主流らしい
https://www.raspberrypi.org/software/
から各種OSに対応したものがダウンロード可能

今回は Ubuntu for x86 をダウンロード

UbuntuでのRaspberry Pi Imagerの使い方

で解説があるので
snap でもインストール可能らしい

今回は
パッケージ版をインストール

途中に必要なパッケージがないとエラーになるうえ
各種インストールしようとしてもエラーとなるため

sudo snap install rpi-imager

でインストール

これで
Imager を起動し
CHOOSE OS

Raspberry Pi OS(32-bit)
をクリックし

CHOOSE STORAGE

SD_MMC – 31.3GB
を選択

これで
WRITE
で書き込みされる
と思ったら
Cannot open storage device ‘/dev/sdc’
となる

他のmicroSD に変えても結果は同じなので

rpi image 1.6 cannot open storage device
で検索し

Raspberry Pi Imager update to v1.6

を参考に
Ctrl-Shift-X
でオプションをだしたがわからないので
NOOBSでインストールすることに
Raspberry PIのインストール方法が変わりNOOBSが使えない – 直接ダウンロードしてインストールする方法

を参考に
http://downloads.raspberrypi.org/
から
NOOBSを直接ダウンロード

http://downloads.raspberrypi.org/NOOBS/images/
からNOOBSのバージョンを選んでダウンロード可能

今回は
NOOBS_v3_7_0.zip
をダウンロード

ダウンロード完了後

unzip NOOBS_v3_7_0.zip -d /media/snowpool/0C12-788A/


microSD を指定して解凍する

次に
ラズパイゼロの準備

カメラモジュールの配線が長すぎるので
Raspberry Pi Zero Wにカメラモジュールを取り付ける

を参考に交換

部品をセットしたら
microSD を差し込んで起動するとインストール画面になるので
そのまま続ける

インストール完了したら
カメラモジュールとSSHができるように設定

sudo raspi-config


Interfacing opinion

PI Camera
P2 SSH
でyes を選ぶ

設定が終われば
Finishを選べばok

これで再起動するとカメラとSSHが使えるようになったので
ssh で ubuntu からアクセスして操作する

次にOS のアップデート

sudo apt update
sudo apt upgrade

実行すると

webkit2gtk (2.31.1-1) experimental; urgency=medium

  Starting from the 2.31.x development versions, support for NPAPI
  plugins has been completely removed from WebKitGTK. This technology is
  deprecated and has already been removed from all major web browsers.

  The last important user of this API was the Adobe Flash Player, which
  reached end of life in December 2020.

 -- Alberto Garcia <berto@igalia.com>  Fri, 15 Jan 2021 17:31:53 +0100

とでるので
とりあえず
q を押して終了させる

アップデートにかなり時間がかかる
約30分以上はかかったので
更新は時間があるときに行わないときついかも

アップデート完了したら
カメラが撮影できるかテスト

これは
raspistill コマンドでできる

オプションが色々あるけと
カメラの向きが変わってることが多々あるので
-o で出力先の変更以外に
-hf で垂直方向へ反転させたり
-hv で水平方向へ反転させることがある

とりあえず、向きに問題ないなら

raspistill -o test.jpg

撮影には5秒ほどのタイムラグがあるので注意

もし撮影できていないのなら
カメラケーブルを確認するといいかも

次に公開鍵認証にする

Ubuntu で ssh-keygenコマンドで作成

-t で暗号形式を rsa
-b で4096ビットに指定
なおデフォルトでは2048ビット

ssh-keygen -t rsa -b 4096

で作成

Enter file in which to save the key (/home/snowpool/.ssh/id_rsa): 

となったらファイル名を入力

今回は zero_camera
としておく

パスフレーズは省略するので

Enter passphrase (empty for no passphrase): 

Enter same passphrase again: 


Enter にすればパスフレーズなしとなる

次に公開鍵の登録

これは
ssh-copy-id コマンドを使う

なお接続するラズパイ3のIPは
Android ならFing で調べることが可能

ssh-copy-id -i zero_camera.pub pi@192.168.1.215

で登録

しかし

/usr/bin/ssh-copy-id: INFO: attempting to log in with the new key(s), to filter out any that are already installed
/usr/bin/ssh-copy-id: INFO: 1 key(s) remain to be installed -- if you are prompted now it is to install the new keys
Received disconnect from 192.168.1.215 port 22:2: Too many authentication failures
packet_write_wait: Connection to 192.168.1.215 port 22: Broken pipe

となる

このため
SSH 接続時に Too many authentication failures と表示される。
https://ez-net.jp/article/08/rJIOlRVJ/p56Xn7J2TJ13/
を参考に設定したがつながらない

Received disconnect from … : Too many authentication failures の解決案

を参考に
IdentitiesOnly=yesを指定すると解決

ssh -o IdentitiesOnly=yes pi@192.168.1.215

これでログインはできた

scp -o IdentitiesOnly=yes  .ssh/zero_camera.pub pi@192.168.1.215:/home/pi/

で作成したファイルをコピー

ssh -o IdentitiesOnly=yes pi@192.168.1.215

でラズパイにログイン

cat zero_camera.pub >> .ssh/authorized_keys
chmod 700 .ssh/
chmod 600 .ssh/authorized_keys 


一度ログアウトし

ssh -i .ssh/zero_camera pi@192.168.1.215


公開鍵認証でログインできるのを確認

sudo apt install vim


vim をインストール

sudo vim /etc/ssh/sshd_config

で設定ファイルを開き

パスワード認証を禁止

PermitEmptyPasswords no
PasswordAuthentication no

AuthorizedKeyFile .ssh/authorized_keys

を設定

sudo /usr/sbin/sshd -t

で設定の確認

sudo /etc/init.d/ssh restart


ssh の再起動

これで
次に Google Drive の設定

Google Drive のマウントに必要なものをインストール

sudo apt install opam
opam init
Do you want opam to modify ~/.profile? [N/y/f]

とでてくるので検索
opamを用いたOCamlプロジェクトのセットアップ方法

によれば
yでOK

A hook can be added to opam's init scripts to ensure that the shell remains in
sync with the opam environment when they are loaded. Set that up? [y/N] 

についても
yでOK

これは opam 設定を 更新するスクリプトをなにかに hook させるか
ということらしい

しかし

[ERROR] Solver failed: "/usr/bin/mccs -i
        /tmp/opam-pi-3186/solver-in-3186-8b8a2d -o
        /tmp/opam-pi-3186/solver-out-3186-d474c2
        -lexagregate[-removed,-count[version-lag:,true],-changed,-count[version-lag:,false],-new]"
        exited with code 255 "ERROR: Cannot read solution from lp solver."
Switch initialisation failed: clean up? ('n' will leave the switch partially
installed) [Y/n] y

となる

続いて

opam update
opam install depext

を実行すると

[ERROR] No switch is currently set. Please use 'opam switch' to set or install
        a switch

となる

OCaml の環境構築

によれば
OPAMがおかしくなったら、 ~/.opam を削除すれば初期化できる
とのことなので

rm -rf .opam/

で一度削除

opam init --solver=mccs

を実行

Do you want opam to modify ~/.profile? [N/y/f]
(default is 'no', use 'f' to choose a different file) no
A hook can be added to opam's init scripts to ensure that the shell remains in
sync with the opam environment when they are loaded. Set that up? [y/N] N

については
デフォルトが N なので
N
にしてみたが変わらないので
一度


<><> Required setup - please read <><><><><><><><><><><><><><><><><><><><><><><>

  In normal operation, opam only alters files within ~/.opam.

  However, to best integrate with your system, some environment variables
  should be set. If you allow it to, this initialisation step will update
  your bash configuration by adding the following line to ~/.profile:

    test -r /home/pi/.opam/opam-init/init.sh && . /home/pi/.opam/opam-init/init.sh > /dev/null 2> /dev/null || true

  Otherwise, every time you want to access your opam installation, you will
  need to run:

    eval $(opam env)

  You can always re-run this setup with 'opam init' later.

Do you want opam to modify ~/.profile? [N/y/f]

で再度 y を選択

最後に

User configuration:
  ~/.profile is already up-to-date.
[NOTE] Make sure that ~/.profile is well sourced in your ~/.bashrc.

となるので

source .bashrc 

を実行

インストールしたOCamlをパスに加えるので

 eval $(opam env)

opam switch list-available

で利用可能なあっケージを調べる

Official release が公式らしい

ocaml-base-compiler                    4.12.0
          Official release 4.12.0
ocaml-variants                         4.12.0+domains
          OCaml 4.12.0, with support for multicore domains
ocaml-variants                         4.12.0+domains+effects
          OCaml 4.12.0, with support for multicore domains and effects
ocaml-variants                         4.12.0+options
          Official release of OCaml 4.12.0
ocaml-variants                         4.12.1+trunk
          Latest 4.12 development
ocaml-base-compiler                    4.13.0~alpha1
          First alpha release of OCaml 4.13.0
ocaml-variants                         4.13.0~alpha1+options
          First alpha release of OCaml 4.13.0
ocaml-base-compiler                    4.13.0~alpha2
          Second alpha release of OCaml 4.13.0
ocaml-variants                         4.13.0~alpha2+options
          Second alpha release of OCaml 4.13.0
ocaml-variants                         4.13.0+trunk
          Latest 4.13 developmet
ocaml-variants                         4.14.0+trunk
          Current trunk

となるので

 opam switch create 4.12.0

としたが

[ERROR] ocaml-base-compiler = 4.12.0 unknown package

となる

OCamlについてとりあえずメモ

を参考に

sudo apt install opam ocaml gcc make bubblewrap m4 pkg-config

をしたが変わらない

再度

rm -rf .opam

で削除し

<><> Creating initial switch (ocaml-system>=4.02.3) <><><><><><><><><><><><><><>
[ERROR] Solver failed: "/usr/bin/mccs -i
        /tmp/opam-pi-1045/solver-in-1045-8b8a2d -o
        /tmp/opam-pi-1045/solver-out-1045-d474c2
        -lexagregate[-removed,-count[version-lag:,true],-changed,-count[version-lag:,false],-new]"
        exited with code 255 "ERROR: Cannot read solution from lp solver."
Switch initialisation failed: clean up? ('n' will leave the switch partially
installed) [Y/n] y

となったので

opam init --solver=mccs

を実行

しかし
同じエラーがでる

再度

Do you want opam to modify ~/.bash_profile? [N/y/f]

のとき
N
を選択し

A hook can be added to opam's init scripts to ensure that the shell remains in
sync with the opam environment when they are loaded. Set that up? [y/N] N

もN
とした

[ERROR] Solver failed: "/usr/bin/mccs -i
        /tmp/opam-pi-1326/solver-in-1326-8b8a2d -o
        /tmp/opam-pi-1326/solver-out-1326-d474c2
        -lexagregate[-removed,-count[version-lag:,true],-changed,-count[version-lag:,false],-new]"
        exited with code 255 "ERROR: Cannot read solution from lp solver."
Switch initialisation failed: clean up? ('n' will leave the switch partially
installed) [Y/n] 

のときに
Y
とした後に

opam update

を実行

このあと

opam install depext

を実行したが

[ERROR] No switch is currently set. Please use 'opam switch' to set or install
        a switch

となる

opam switch create 4.12.0

を実行すると

[ERROR] Solver failed: "/usr/bin/mccs -i
        /home/pi/.opam/log/solver-in-1418-7afd23 -o
        /home/pi/.opam/log/solver-out-1418-5f1023
        -lexagregate[-removed,-count[version-lag:,true],-changed,-count[version-lag:,false],-new]"
        exited with code 255 "ERROR: Cannot read solution from lp solver."
Switch initialisation failed: clean up? ('n' will leave the switch partially
installed) [Y/n] Y

となる

エラーログから

Please use 'opam switch' to set or install         a switch

とあったので検索
opam not creating a switch #4023

の中の

There is some packaging issues of opam (cf. #3827), it should use builtin solver, but it packaged with aspcud.

Can you try this workaround ?

を参考に

aspcud install

で検索

How To Install “aspcud” Package on Ubuntu

を参考に

sudo apt install aspcud 

でインストール

debian testing/ubuntu disco opam packages result in solver failure on init

を参考に

opam switch create 4.12.0 --solver=mccs

としたが変わらない

このため一度以前作成したラズパイゼロとの
バージョン差分を調べることにする

opam --version 

で調べた結果
2.0.3
に対し

以前作成したものは
ver 1.2.2
だった

このため一度 Google Drive への保存を保留にして
先に Bluetooth ボタンでシャットダウン機能の実装とOpenCVを先に実験する

今回作成するものは車で走行しているときの動画の保存と解析が目的
なので
古い写真と動画を圧縮保存するようにして
自宅に帰ったときにNASに保存するようにする

まず bluetooth の設定

sudo apt install bluez bluetooth libbluetooth-dev build-essential
sudo apt install bluez-cups

で必要なパッケージのインストール

次にgem でインストール

sudo apt install ruby
sudo gem install bluebutton

これはダイソーの300円のボタンを使う

sudo bluetoothctl
power on
scan on 


MACアドレスを表示されたら

connect FF:FF:9A:4A:49:94
pair FF:FF:9A:4A:49:94
trust FF:FF:9A:4A:49:94

とする

しかし電池が少ないため途中で接続が途切れる

このため先に opencv の設定をする

【Raspberry Pi】Raspberry Pi Zero WにOpenCVの環境を構築する

sudo apt-get install python3-pip
sudo apt-get install libatlas-base-dev
sudo apt-get install libjasper-dev
sudo apt-get install qt4-dev-tools qt4-doc qt4-qtconfig libqt4-test
pip3 install opencv-python

これでpython3 の後に

import cv2 

とすると

Type "help", "copyright", "credits" or "license" for more information.
>>> import cv2
RuntimeError: module compiled against API version 0xe but this version of numpy is 0xd
Traceback (most recent call last):
  File "<stdin>", line 1, in <module>
  File "/home/pi/.local/lib/python3.7/site-packages/cv2/__init__.py", line 5, in <module>
    from .cv2 import *
ImportError: numpy.core.multiarray failed to import

となる

このため
import cv2 で謎の”ImportError”が出た…[OpenCV for Python3]

を参考に

pip install -U numpy

インストールはできたようだが

  The scripts f2py, f2py2 and f2py2.7 are installed in '/home/pi/.local/bin' which is not on PATH.
  Consider adding this directory to PATH or, if you prefer to suppress this warning, use --no-warn-script-location.

とエラーがでる

  The scripts f2py, f2py2 and f2py2.7 are installed in '/home/pi/.local/bin' which is not on PATH.


検索した結果
NumPy、pandas、Matplotlib をpipでインストールする方法

によれば
f2pyは
FORTRANのコードをPythonで使えるようにするプログラム

警告内容のようにPATHを通さなくても

py -m numpy.f2py

で呼び出せるらしいので
そのまますすめる

この状態で

import cv2

として何もエラーがでなければ成功

バージョン確認は

cv2.__version__

でOK

ctrl + d で抜ける

とりあえず
opencv の設定はできたので
次に定期的にカメラで動画撮影する

動画の撮影は
raspivid コマンド
もしくは
motion コマンド
でできる

motion の場合動体検知などができるが
今回は raspivid コマンドで実行する

出力されるファイル形式は
.h264 になる

-t でミリ秒単位で撮影時間を指定できる
なおミリ秒は0.001 秒なので
10000ミリ秒なら10秒となる

-rot で角度の指定が可能
180度回転させるなら
-rot 180
となる

カメラの向きが上下反転しているなら
-vf

左右反転なら
-hf
を指定することで解決

これについては

Raspberry Pi Zeroで簡易ドライブレコーダーを自作する

を参考に

取り付ける場所がルームミラーの裏にしたいので
横向きになるので

raspivid -o test.h264 -rot 270 -t 10000

とすることで角度調整ができた

次に
-fps でフレームノート
-b でビットレートを指定する

ファイル名がかぶらないように
date コマンドで日時を撮影した日時にして保存する

raspivid -o `date '+%Y%m%d-%H%M'`.h264 \
-rot 270 -w 1280 -h 720 -t 20000 -fps 30 -b 2000000

これをスクリプトファイルにするので

vim video.sh

でファイルを作成し

#!/bin/sh
raspivid -o `date '+%Y%m%d-%H%M'`.h264 \
-rot 270 -w 1280 -h 720 -t 20000 -fps 30 -b 2000000

として保存

なお

 `date '+%Y%m%d-%H%M'

はバッククォートで囲っている
shift + @ でバッククォートになる

‘ と似ているので注意

chmod +x video.sh

で実行権限を付与

これを cron で実行できるようにする

crontab -e

を実行

no crontab for pi - using an empty one

Select an editor.  To change later, run 'select-editor'.
  1. /bin/nano        <---- easiest
  2. /usr/bin/vim.basic
  3. /usr/bin/vim.tiny
  4. /bin/ed

となりどのエディタを使うか聞かれる
今回はvim にしたいので
2
を選択

最終行に

*/1 * * * * /home/pi/video.sh

を追記して保存

これで1分ごとに20秒の動画が撮影される

このままだとどんどんファイルが増えていくので

mkdir drive_rec

で動画を保存するディレクトリを作成

#!/bin/sh
raspivid -o /home/pi/drive_rec/`date '+%Y%m%d-%H%M'`.h264 \
-rot 270 -w 1280 -h 720 -t 20000 -fps 30 -b 2000000

というように保存先を指定

今まで撮影したファイルについては

mv *.h264 drive_rec/

で一緒に保存しておく

これで一日おいておいたらすごい量のファイルになっているので
シャットダウンボタンを設定する

sudo pip3 install evdev


キーイベント取得のためのモジュールインストール

あと
100均Bluetoothボタンをラズパイ活用


別の機器(ラズパイやスマホ)に繋ぐ場合は、最後に繋げた機器とペアリングを確実に削除すること(デバイスの電源OFFや電池を抜いてもダメ)
とあったので
新規に電池とともに
ダイソーで購入することに

一日たってから

df -h

で容量を確認したところ
5GBほど容量をとりほぼ夜中は起動しても無駄になりそうなので
motion で撮影することに

これなら動体検知になるのでそこまで容量をとらないはず

 sudo nano /etc/modules

でファイルを開き

bcm2835-v4l2

を最終行に追記

あとは

sudo reboot

で再起動

次に motion のインストール

sudo apt update

でリポジトリを更新し

sudo apt install -y motion

で motion をインストール

次に設定ファイルの編集

sudo vim /etc/motion/motion.conf 

で設定ファイルを開き

11行めの

daemon off

daemon on

に変更

79行目あたりの

width 320 

width 640 

に変更

height 240

height 480

に変更

86行目あたりの

framerate 2

framerate 10

に変更
framerateは
動体を検知した時に画像をキャプチャするフレームレートの最大値
大きくするとCPU負荷も上がるが
動きがなめらかになる

233行目あたりの

event_gap 60

event_gap 10

に変更
eventgap は
動体検知が収まってから再度検知するまでの秒

461行めの

stream_localhost on

stream_localhost off

に変更
stream_localhost は
ライブストリームへのアクセスをローカルホストからのみに制限する
on だとローカルホストのみ

次に撮影関連の設定
デフォルトだと撮影時間が無制限なので
237行目の

max_movie_time 0

から任意の撮影秒数に変更

今回は20秒に設定

max_movie_time 20

とした

これで保存

そして、自動的に motion を起動できるようにしたいので

sudo nano /etc/default/motion 

でファイルを開き

start_motion_daemon=no

start_motion_daemon=yes

として保存

次に insserv パッケージをインストール

 sudo apt install insserv

あとは

sudo insserv motion

これで自動起動設定も完了

もし、自動起動していないのなら

sudo motion

で motion を起動

しかしうまく起動していないため
深夜での撮影はしないため
撮影する時刻を
朝5時から夜9時までに変更するため

crontab -e

*/1 * * * * /home/pi/video.sh

*/1 5-21 * * * /home/pi/video.sh

として保存

設定は左から
分 時 日 月 曜日
となっている

書き方については
crontabの書き方

を参考に

次に古いファイルの削除

基本的に週1でデータ管理しようと思うので
それ以前のデータは削除するようにする

Raspberry Pi で監視カメラを作ってみた

を参考にスクリプトを設定

sudo vim /etc/cron.daily/delete_movie.sh

内容を

#!/bin/bash
find ~/drive_rec/ \( -name '*.h264' \) -mtime +7 -delete 
exit 0

として保存

sudo chmod +x /etc/cron.daily/delete_movie.sh 

で実行権限付与

これで7日間変更がないなら削除されるようになる

ボタン電池を購入したのでbluetooth ボタンの続き

簡易ドライブレコーダーZeroWにBluetoothボタンでオンオフ編

を参考に

sudo apt install bluez bluetooth libbluetooth-dev build-essential
sudo apt install bluez-cups

これで

vim shutdown.sh

でファイルを作成

#!/bin/bash
sudo shutdown -h now

として保存

sudo chmod +x shutdown.sh 

で実行権限付与

sudo vim ~/.config/bluebutton

で内容を

keyup=echo UP && ~/shutdown.sh
keydown=echo DOWN
longup=echo LONG UP
longdown=echo LONG DOWN

として保存

sudo bluebutton -c ~/.config/bluebutton

だと

sh: 1: /root/shutdown.sh: not found

となってしまうが

bluebutton -d="AB Shutter3" -c /home/pi/.config/bluebutton

として
ボタンを押すと無事にシャットダウンができた

このままだと使えないので
起動したら
bluetooth が使えるように設定

Crontabにシステム起動時に1度だけコマンドが実行されるように設定する方法

によれば

@reboot
で設定ができるらしい
Shutter3とRaspberry Pi Zero Wを使ったBluetoothボタンの制御まとめ

で書いてあったものを参考に

vim blbtn.sh

#!/bin/sh
command="bluebutton -d="AB Shutter3" -c /home/pi/.config/bluebutton"
eval $command

として保存

chmod +x blbtn.sh

で実行権限付与

crontab -e

で最終行に

@reboot /home/pi/blbtn.sh

を記述して保存

実際に起動しているか調べるため再起動

しかし動作しないためこれは保留
100均のBluetoothシャッターとRaspberry Piカメラでオンラインデジカメを作ってみた

を参考に

sudo vim ~/.config/bluebutton 

でファイルを編集

内容を

keyup=echo UP ; ~/shutdown.sh
keydown=echo SHUTDOWN 
longup=echo LONG UP
longdown=echo LONG DOWN

として保存

 which bluebutton 


bluebutton のパスを確認したら

/usr/local/bin/bluebutton

だったので

crohtab -e

で設定ファイルを開き

@reboot /home/pi/blbtn.sh

を削除

@reboot /usr/local/bin/bluebutton -d="AB Shutter3" -c /home/pi/.config/bluebutton

を最終行に追記

これで

sudo reboot

で再起動させて
しらばくたってから
AB Shutter3
のボタンを押すとシャットダウンが実行される

なお端末画面には
ECHO で設定した画面が表示されないので注意

またすでに他のラズパイzero で実験している場合
一度ペアリングを解除しないと他の端末で使えないので注意

bluetoothctl

でペアリング解除などが載っているので参考に